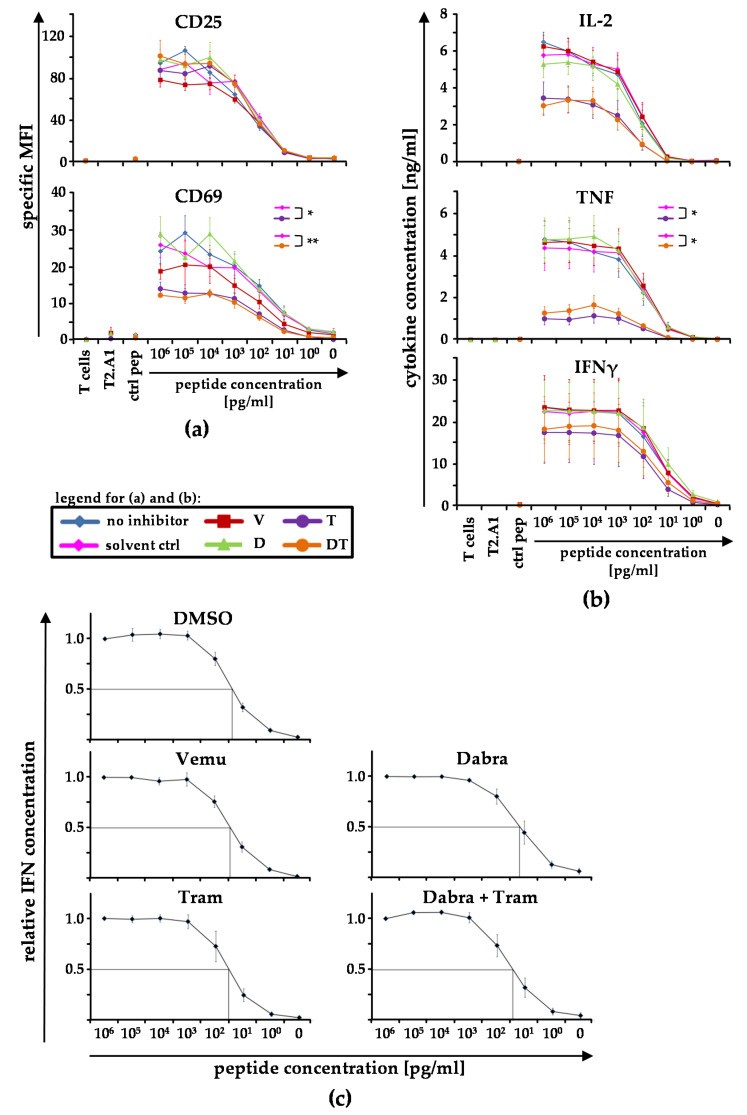
Figure 3.
BRAF and MEK inhibitors do not affect T-cell avidity: CD8+ T cells were electroporated with RNA coding for a gp100-specific T-cell receptor (TCR). UV-irradiated T2.A1 cells were either left untreated (peptide concentration 0 pg/mL), loaded with control peptide MelanA analogue (ctrl pep), or loaded with the respective gp100 peptide at the indicated concentrations (106−100 pg/mL). T cells and T2.A1 cells were cultured at a 1:1 ratio in the presence of solvent control (DMSO), vemurafenib (V), dabrafenib (D), trametinib (T), or the clinically used combination D + T (DT) or without inhibitor treatment (no inhib). gp100-TCR-transfected CD8+ T cells (T cells) and irradiated T2.A1 cells (T2.A1) cultured alone or in the presence or absence of BRAF- or MEK-inhibitors, respectively, served as negative controls. After 17−20 h, cells (a) and supernatants were sampled (b,c). (a) Cells were stained for CD25 and CD69 expression and were subsequently analyzed by flow cytometry. The expression of both markers is depicted as specific MFI (i.e., MFI after subtraction of background MFI of the respective isotype control antibodies). (b) IL-2, TNF, and IFNγ concentrations in the supernatants were assessed by Cytometric Bead Array (CBA). (a,b) Mean values ± SEM of four donors are depicted. p-values were determined by two-way ANOVA. All the conditions were tested against the solvent control DMSO and are displayed in the respective graph. * p ≤ 0.05, ** p ≤ 0.01. (c) Relative IFNγ concentrations were calculated (normalized on the 106 pg/mL data set) and are depicted for each inhibitor. Mean values ± SEM of six (DMSO), seven (vemu), and four donors (dabra, tram, and dabra + tram) are depicted. To quantify changes in the functional avidity, we determined the peptide concentrations, which corresponded with the half-maximal relative IFNγ concentrations (i.e., ED50; lines).

