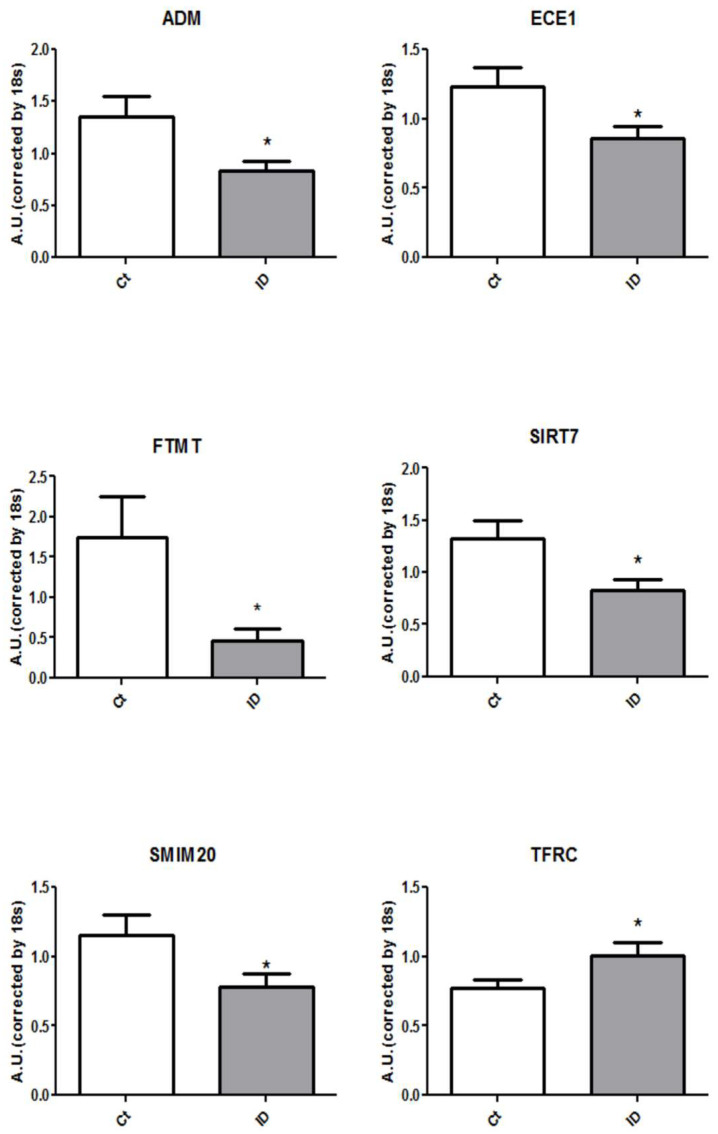
Figure 2.
ADM, ECE1, FTMT, SIRT7, SMIM20 and TFRC genes are differentially expressed in the whole blood of ID (iron deficiency) patients versus the control ones. Graph representation of the 6 mRNA levels from blood in both studied populations. Data were normalized by the 18 s and expressed as mean ± SEM (* p < 0.05 vs. Control).

