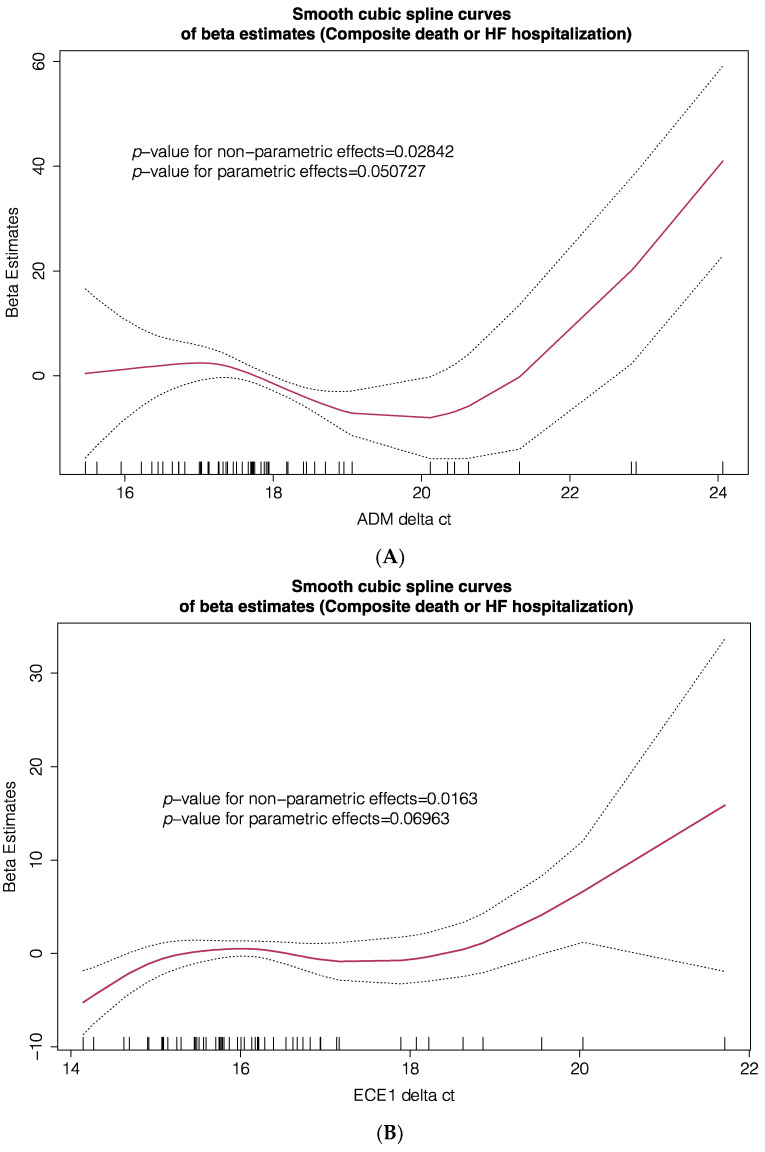
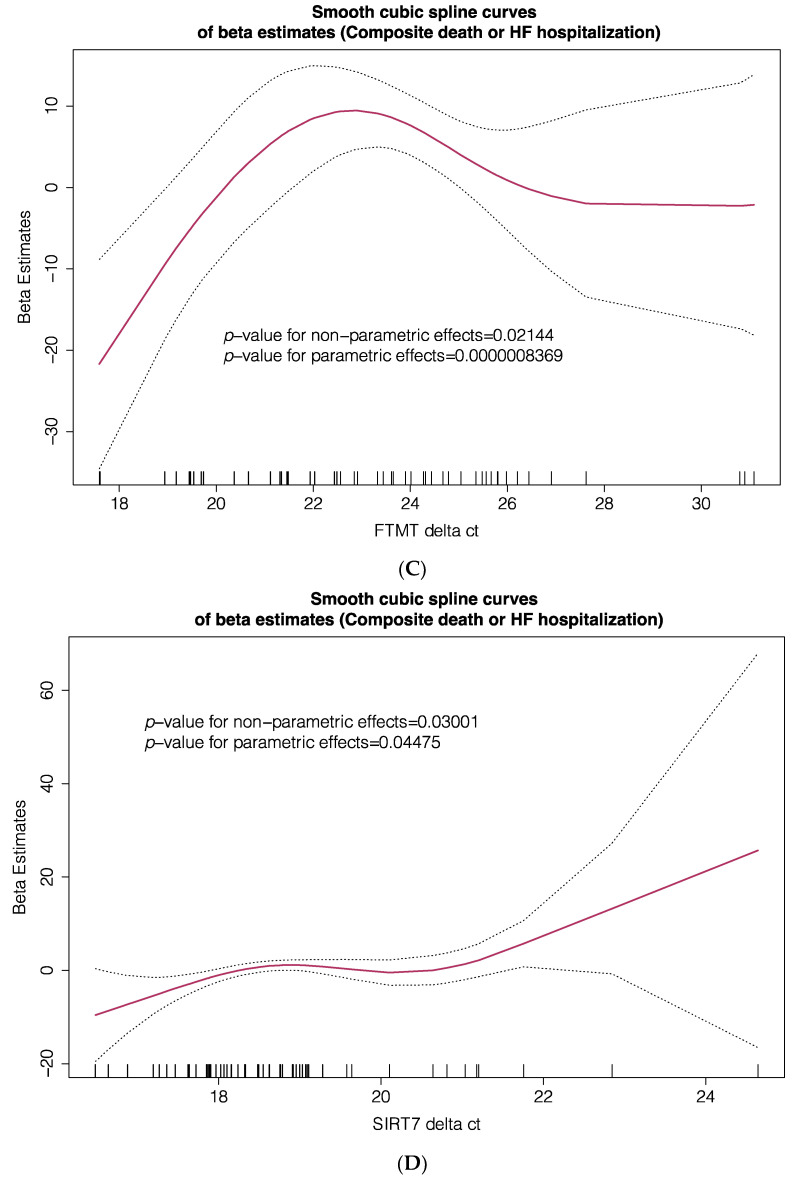
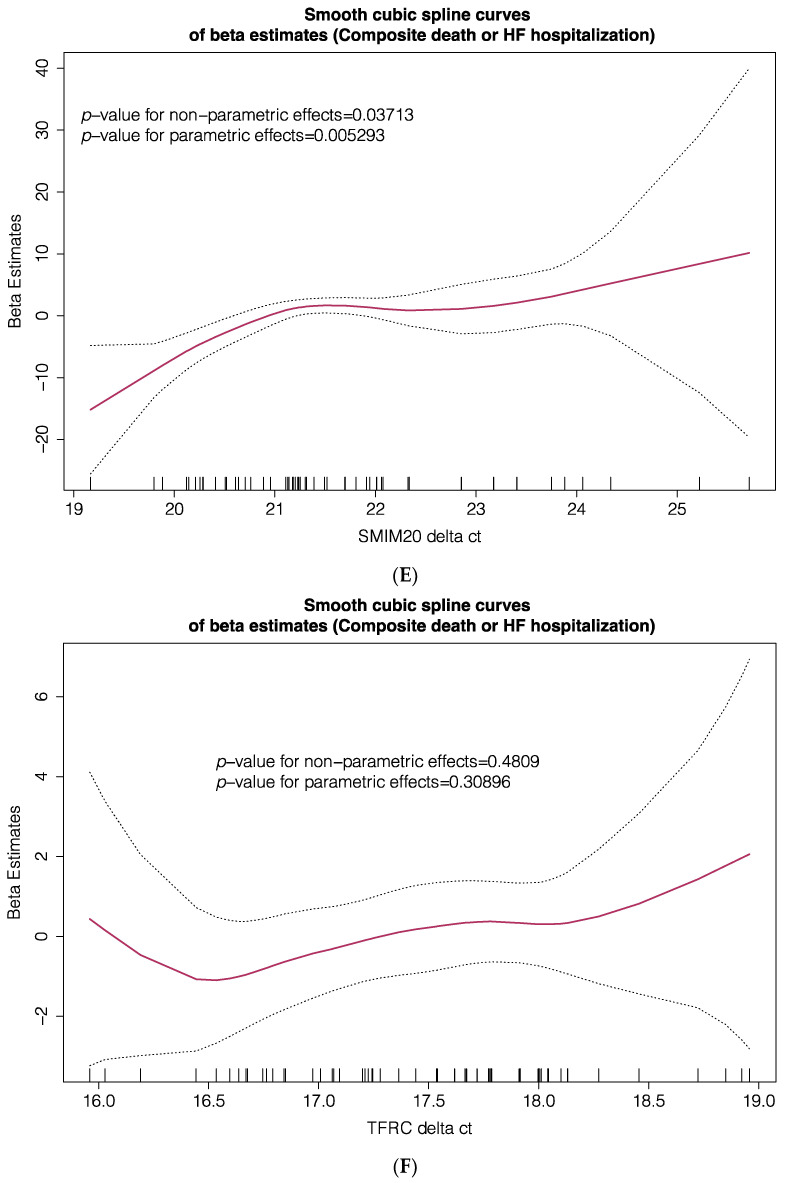
Figure 3.
Smooth spline estimates of the composite endpoint (all-cause death or HF hospitalization) according to gene expression of ADM (A), ECE1 (B), FTMT (C), SIRT7 (D), SMIM20 (E) and TFRC (F). Δct: change in gene expression cycle threshold). Ct levels are inversely proportional to the amount of target nucleic acid in the sample (i.e., the lower the Ct level the greater the amount of target nucleic acid in the sample). Plots show the beta estimates of the outcome.


