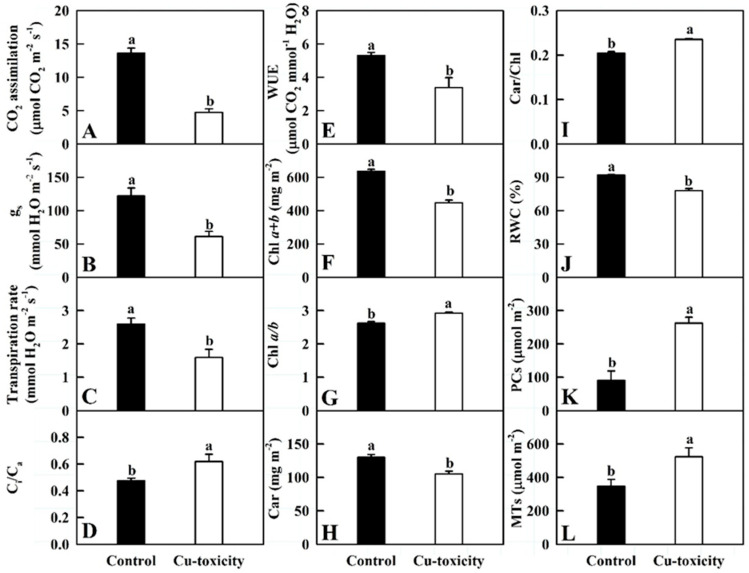
Figure 2.
Cu-toxic effects on mean (± SE, n = 7 except for 5 for Chl and Car and 4 for RWC, PCs and MTs) CO2 assimilation (A), stomatal conductance (gs, (B)), transpiration rate (Tr, (C)), ratio of intercellular to ambient CO2 concentration (Ci/Ca, (D)), water use efficiency (WUE, (E)), chlorophyll (Chl) a + b (F), Chl a/b (G), carotenoids (Car, (H)), Car/Chl (I), relative water content (RWC, (J)), phytochelatins (PCs, (K)) and metallothioneins (MTs, (L)) in leaves. Different letters above the bars indicate a significant difference at p < 0.05.

