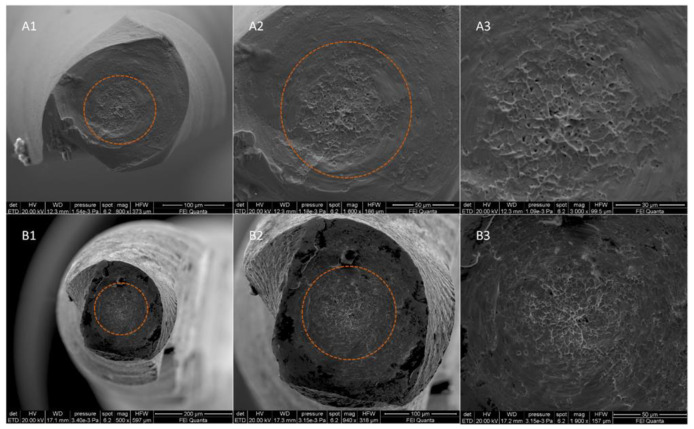
Figure 2.
SEM images of fractured surface of two samples of F-One 20.04 in a transversal view at different magnifications after torsional fatigue testing. Images (A1–A3) represent SEM captures of an austenitic instrument, while images (B1–B3) represent SEM captures of a martensitic instrument. All acquisition specifications are shown in the black box below each image. The concentric circular abrasion marks and fibrous dimples near the center of rotation are evidenced by the orange circumferential lines.

