Figure 2. Gene expression changes confirm absence of pre-B cells in Mb1-cre ABCB7 conditional knockout (cKO) mice.
Analysis of critical transcription factors in wild-type (WT) and Mb1-cre ABCB7 cKO Fr. C cells (B220+CD19+CD43+BP-1+). (A–G) Intracellular flow cytometry analysis of EBF1 (A), E47 (E2A) (B), FOXO1 (C), PAX5 (D), IKAROS (E), AIOLOS (F), and IRF4 (G) expression. Quantification of MdFI is shown on the right of each plot. Isotype controls are shown in gray. Offset histograms are representative of at least three independent experiments (total of 6–10 mice/group). (H, I) Flow cytometry analysis of CD2 (H) and CD25 (I) expression. Indicated values are the proportion of Fr. C cells positive for either marker, and quantifications are shown on the right of each plot. Offset histograms are representative of three independent experiments (total of five mice/group). (J) Intracellular flow cytometry analysis of TdT expression in Fr. B and Fr. C cells. Indicated values are the proportion of cells positive for TdT expression, and quantifications are shown on the right. Offset histograms are representative of three independent experiments (total of 5–7 mice/group). (K) Quantitative real-time PCR analysis of Rag1 and Rag2 expression in sorted Fr. B and Fr. C cells. 18S rRNA was used as an endogenous control, and relative expression values were normalized to expression in WT Fr. B cells. Results were obtained from three independent experiments (total of 3–4 mice/group). (A–K) Error bars represent SEM, and p-values are indicated above the data. Statistics were obtained by using an unpaired Student’s t-test.

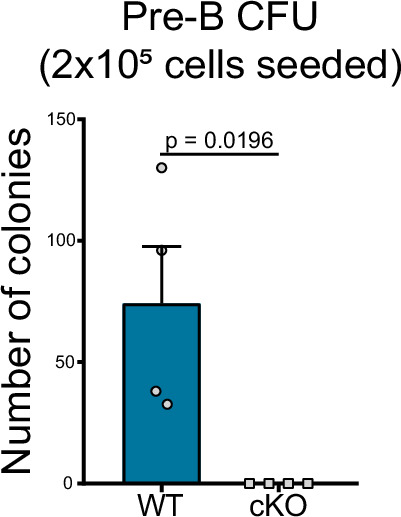
Figure 2—figure supplement 1. Failure to generate pre-B cell colony-forming unit (CFU) from Mb1-cre ABCB7 conditional knockout (cKO) mice.