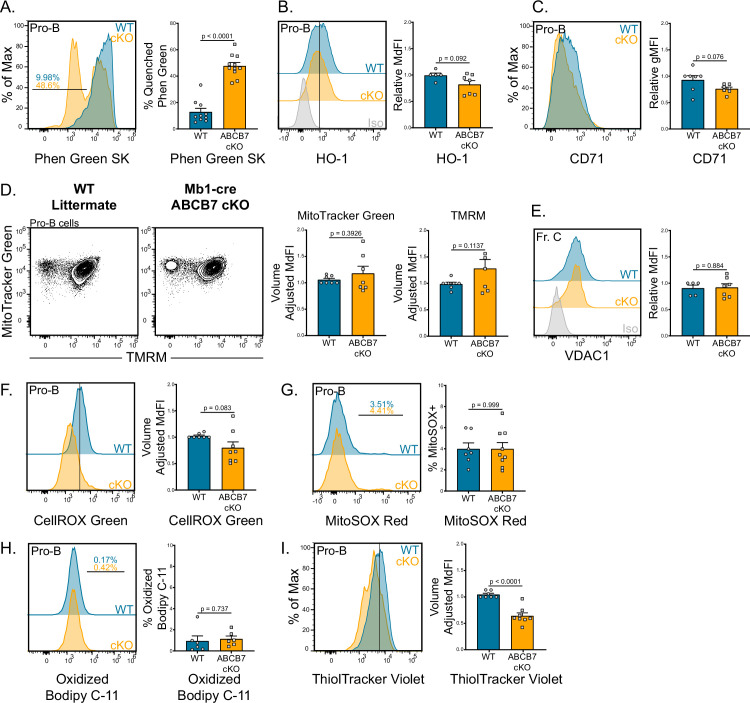
Figure 3. Iron accumulation in ABCB7-deficient pro-B cells. Analysis of mitochondria, iron accumulation, and reactive oxygen species (ROS) in wild-type (WT) and Mb1-cre ABCB7 conditional knockout (cKO) pro-B cells (B220+ CD19+ CD43+).
(A) Flow cytometry analysis of Phen Green SK fluorescence quenching by heavy metal atoms. Indicated values are the proportion of cells with quenched fluorescence, and quantification is shown on the right. Overlaid histogram is representative of five independent experiments (total of 10–11 mice/group). (B) Intracellular flow cytometry analysis of HO-1 expression. Quantification of HO-1 MdFI is shown on the right. Offset histogram is representative of three independent experiments (total of 5–7 mice/group). (C) Flow cytometry analysis of CD71 expression. Quantification of CD71 gMFI is shown on the right. Overlaid histogram is representative of three independent experiments (total of seven mice/group). (D) Flow cytometry analysis of mitochondria abundance (MitoTracker Green) and membrane potential (tetramethylrhodamine methyl ester [TMRM]). Quantification of MitoTracker Green volume-adjusted MdFI and TMRM volume-adjusted MdFI is shown on the right. Contour plots are representative of four independent experiments (total of seven mice/group). (E) Intracellular flow cytometry analysis of VDAC1 expression in Fr. C cells (B220+ CD19+ CD43+ BP-1+). Quantification of VDAC1 MdFI is shown on the right. Offset histogram is representative of three independent experiments (total of 5–7 mice/group). (F) Flow cytometry analysis of CellROX Green ROS detection probe. Quantification of CellROX Green volume-adjusted MdFI is shown on the right. Offset histogram is representative of five independent experiments (total of 7–8 mice/group). (G) Flow cytometry analysis of MitoSOX Red mitochondrial ROS detection probe. Indicated values are the proportion of cells positive for MitoSOX Red dye, and quantification is shown on the right. Offset histogram is representative of four independent experiments (total of 7–9 mice/group). (H) Flow cytometry analysis of Bodipy C-11 lipid peroxidation probe. Indicated values are the proportion of cells positive for oxidized Bodipy C-11, and quantification is shown on the right. Offset histogram is representative of three independent experiments (total of six mice/group). (I) Flow cytometry analysis of ThiolTracker Violet glutathione detection agent. Quantification of ThiolTracker Violet volume-adjusted MdFI is shown on the right. Overlaid histogram is representative of four independent experiments (total of 7–8 mice/group). (A–H) Error bars represent SEM, and p-values are indicated above the data. Statistics were obtained by using an unpaired Student’s t-test.
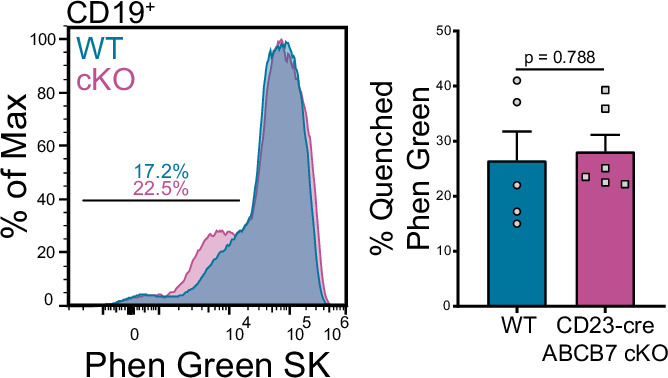
Figure 3—figure supplement 1. Splenic B cells in CD23-cre ABCB7 conditional knockout (cKO) do not have iron accumulation.


