. 2021 Oct 28;10:e68627. doi: 10.7554/eLife.68627

Figure 3. Arp2/3-mediated actin polymerization and myosin-II have distinct roles in phagocytic force generation and progression.

(a) Confocal images of drug-treated fixed RAW cells phagocytosing deformable acrylamide-co-acrylic acid micro (DAAM)-particles functionalized with IgG and AF488-Cadaverine for visualization. Cells were treated with DMSO, CK666 (150 μM), and Blebbistatin (15 μM) for 30 min prior to phagocytic challenge. Each target is approximately 60% engulfed. Fixed cells were stained for F-actin, and particles were labeled with a fluorescent secondary antibody to reveal the exposed surface. Left column: composite maximum intensity projections (MIP) of confocal z-stacks, second to third column: single confocal slices through particle centroid. Scale bar, 5 μm. (b) Particle shape reconstructions from (a) revealing cell-induced target deformations and localization of F-actin over the particle surface. Stars mark the base of the phagocytic cup, cups are aligned with the phagocytic axis (see Figure 2e) from left to right. Scale bars, 3 μm. (c) Normal and shear stresses derived from target deformations. Negative normal forces denote (inward) pushing forces. (d) Average profiles of target deformation and F-actin intensity along the phagocytic axis. Signals were first processed on a per-particle basis by averaging over the surface along the phagocytic targets in 30 bins. Targets before 40% engulfment were excluded. (e, f) Violin plots showing individual phagocytic events (colored markers), mean (black cross), and median (dashed line). (e) F-actin peak intensity and band width. (f) F-actin intensity in the cup (behind the rim), measured right (3 μm) behind the main peak for each particle. (g) Phagocytic efficiency upon drug treatment evaluated as the number of internalized particles divided by the total number of cell-associated particles. Uptake was evaluated 15 min after addition of particles and normalized to internalization by DMSO-treated cells. Three independent experiments were performed where 80–200 particles were measured per condition for each experiment. ***p = 0.0007 (t-test result for hypothesis, mean = 1). (h) Upper panel, cumulative distribution function of the engulfment stage of randomly selected phagocytic events before completion of engulfment (n = 68, 63, 73 respectively) from three independent experiments. Two sample Kolmogorov-Smirnov test was used (p = 0.016*). Lower panel, fraction late-stage cups. Error bars indicate st.d. estimated by treating phagocytosis as a Bernoulli process. Fisher’s exact test was used to compare fractions (p = 1.9 × 10⁻⁴)***. (i) Sphericity and (j) constriction magnitude of DAAM-particle changes with phagocytic progression upon drug treatment. Colored markers indicate individual events, black lines indicate averages of five bins. Right column, violin plots of all events. Marker and line styles as in (e). All statistical tests were two-sided Wilcoxon rank sum test comparing with the DMSO control (gray) over the same bin with significance levels: p < 0.05*; p < 0.01**; p < 0.001***, unless otherwise indicated. All error bars indicate s.e.m. unless indicated otherwise. Raw data are available in Figure 3—source data 1 and raw images are available on a FigShare repository (Barger et al., 2021a).

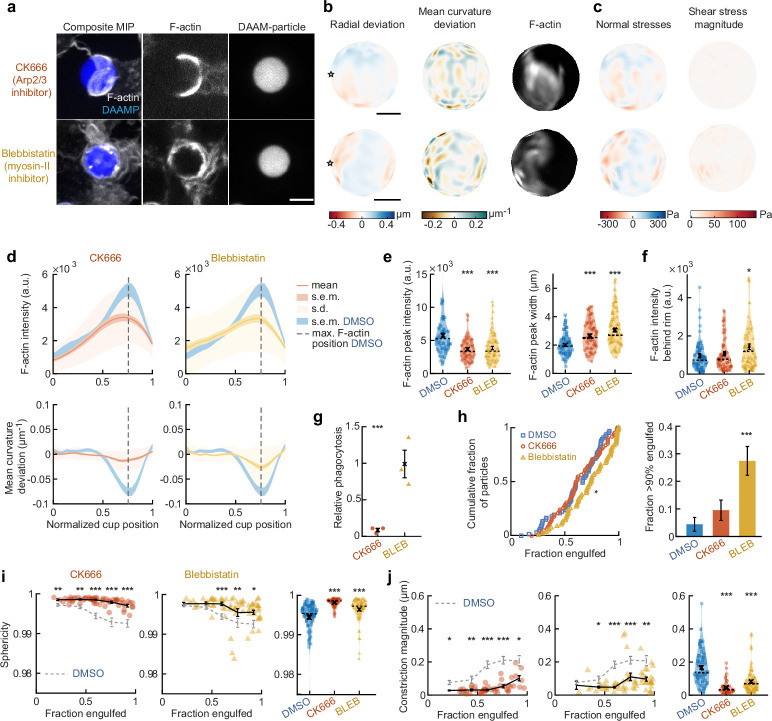
Figure 3—source data 1. Numeric data for Figure 3d–j and Figure 3—figure supplement 1a–e.
elife-68627-fig3-data1.xlsx (544.6KB, xlsx)

Figure 3.

Figure 3—figure supplement 1. Actin organization and target deformation along the phagocytic axis are affected by perturbation of actomyosin activity.

Figure 3—figure supplement 1.

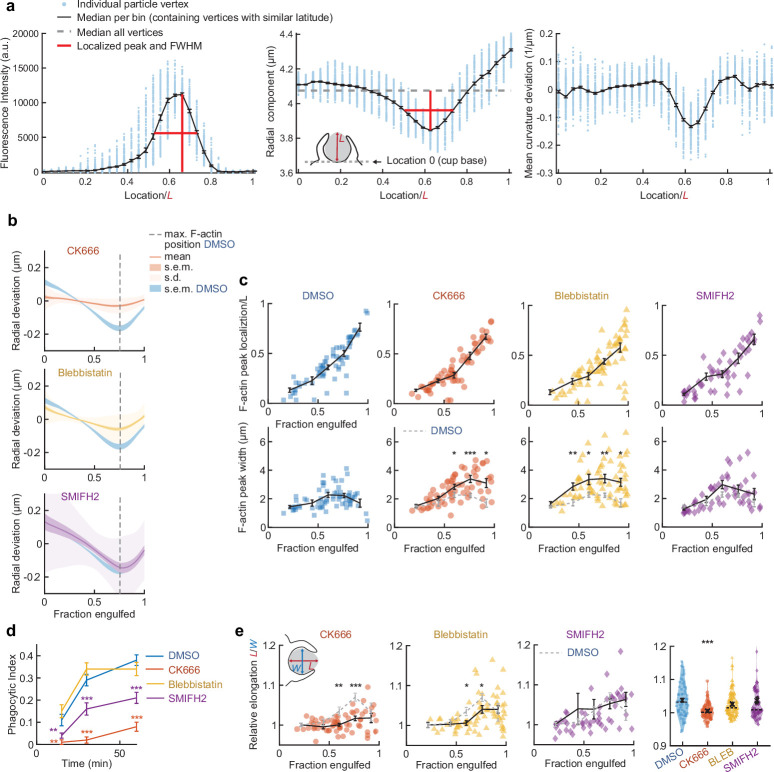
(a) Determination of F-actin and contractile ring localization, peak magnitude, and peak width. Particles were aligned with the centroid of the cell-target contact area (base of the cup) at the south pole (see inset middle panel). All particle edge coordinates (~4250) were then divided into bins per latitude of which the median was calculated. Finally, peak height, location, and full width at half maximum (FWHM) were determined. Data shown corresponds to the particle in the third column, second to last row in Figure 2—figure supplement 1. (b) Average target deformation profiles along the phagocytic axis until the cup rim. Signals were first processed on a per-particle basis by averaging over the surface along the phagocytic targets in 30 bins. (c) Determination of F-actin statistics along the phagocytic axis for all phagocytic events (n = 68, 63, 73, and 55 respectively). Colored markers indicate individual measurements, black lines indicate averages within five bins. (d) Uptake efficiency over time. Cells were fixed at various time points and immunostaining of the deformable acrylamide-co-acrylic acid-microparticle (DAAMP) surface was used to differentiate internalized from external particles. Shown is a single time course representative for two experiments with 80–400 cups measured for each condition/time point. Phagocytic index is defined as the number of internalized particles divided by all cell-associated particles. Error bars indicate st.d. estimated by treating phagocytosis as a Bernoulli process. Fisher’s exact test was used to compare fractions (p < 0.01**; p < 0.001***). (e) Target elongation changes with phagocytic progression upon drug treatment. Marker and line styles as in (c). Inset in leftmost panel shows schematically how relative elongation was determined. Right column, violin plots of all events, showing individual phagocytic events (colored markers) mean (black cross), median (dashed line). Statistical tests for all figure panels are two-sided Wilcoxon rank sum test comparing with the DMSO control over the same bin with significance levels: p < 0.05*; p < 0.01**; p < 0.001***, unless otherwise indicated.
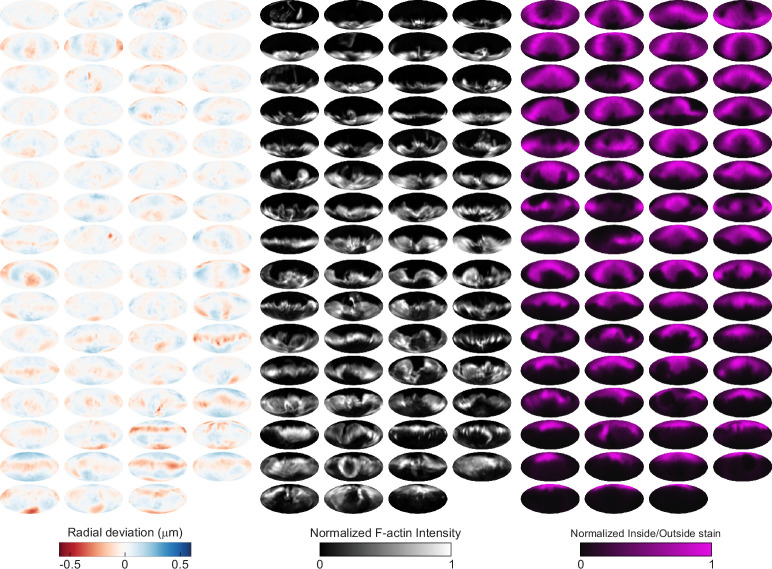
Figure 3—figure supplement 2. Automated image analysis reveals deformation, F-actin localization, and inside/outside (I/O) stain for 63 phagocytic events in CK666-treated cells.

Figure 3—figure supplement 2.

Visualization of deformations, F-actin intensity, and I/O stain for all 63 particles being phagocytosed by CK666-treated cells used in this manuscript shown using Mollweide projections. Particles are sorted by phagocytic stage, with the upper left the lowest percentage of the particle surface area engulfed and the bottom right the highest percentage.
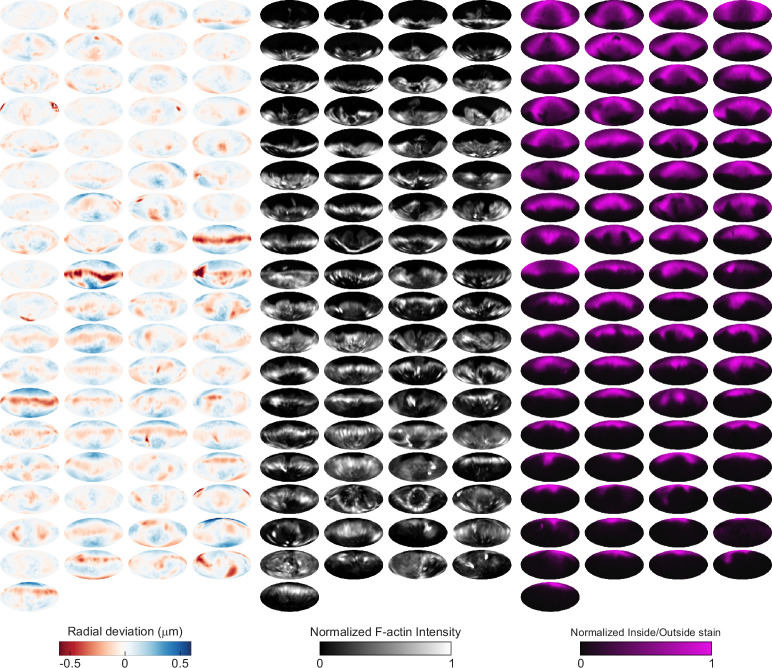
Figure 3—figure supplement 3. Automated image analysis reveals deformation, F-actin localization, and inside/outside (I/O) stain for 75 phagocytic events in Blebbistatin-treated cells.

Figure 3—figure supplement 3.

Visualization of deformations, F-actin intensity, and I/O stain for all 75 particles being phagocytosed by Blebbistatin-treated cells used in this manuscript shown using Mollweide projections. Particles are sorted by phagocytic stage, with the upper left the lowest percentage of the particle surface area engulfed and the bottom right the highest percentage.
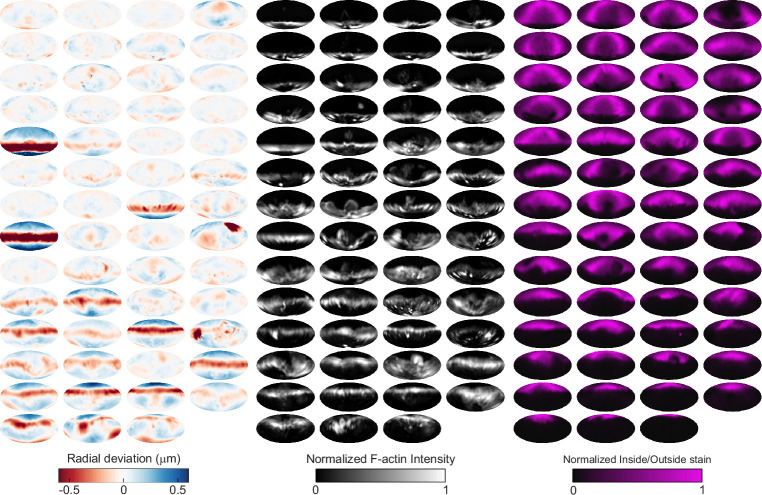
Figure 3—figure supplement 4. Automated image analysis reveals deformation, F-actin localization, and inside/outside (I/O) stain for 55 phagocytic events in SMIFH2-treated cells.

Figure 3—figure supplement 4.

Visualization of deformations, F-actin intensity, and I/O stain for all 55 particles being phagocytosed by SMIFH2-treated cells used in this manuscript shown using Mollweide projections. Particles are sorted by phagocytic stage, with the upper left the lowest percentage of the particle surface area engulfed and the bottom right the highest percentage.
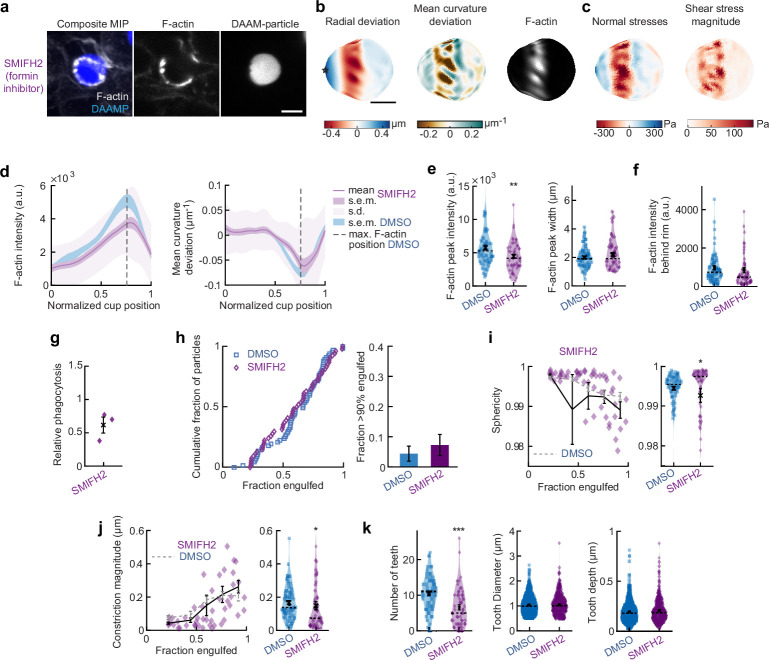
Figure 3—figure supplement 5. SMIFH2 treatment has modest effect on force generation and F-actin distribution during phagocytosis.

Figure 3—figure supplement 5.

(a) Confocal images of representative SMIFH2-treated fixed RAW cell phagocytosing deformable acrylamide-co-acrylic acid-micro (DAAM)-particle functionalized with IgG and AF488-Cadaverine for visualization. Cells were treated with 10 μM SMIFH2 for 30 min prior to phagocytic challenge. The target is approximately 60% engulfed. Fixed cells were stained for F-actin, and particles were labeled with a fluorescent secondary antibody to reveal the exposed surface. Left column: composite maximum intensity projection (MIP) of confocal z-stacks, second to third column: single confocal slices through particle centroid. Scale bar, 5 μm. (b) Particle shape reconstructions from (a) revealing cell-induced target deformations and localization of F-actin over the particle surface. Stars mark the base of the phagocytic cup, cups are aligned with the phagocytic axis (see Figure 1e) from left to right. Scale bars, 3 μm. (c) Normal and shear stresses derived from target deformations. Negative normal forces denote (inward) pushing forces. (d) Average profiles of target deformation and F-actin intensity along the phagocytic axis. Signals were first processed on a per-particle basis by averaging over the surface along the phagocytic targets in 30 bins. Targets before 40% engulfment were excluded. (e, f) Violin plots showing individual phagocytic events (colored markers), mean (black cross), and median (dashed line). (e) F-actin peak intensity and band width. (f) F-actin intensity in the cup (behind the rim), measured right (3 μm) behind the main peak for each particle. (g) Phagocytic efficiency evaluated as the number of internalized particles divided by the total number of cell-associated particles upon SMIFH2 treatment. Three independent experiments were performed, and uptake was evaluated 15 min after addition of particles and normalized to internalization by DMSO-treated cells. t-Test result for hypothesis that the mean = 1 revealed no significant (n.s.) difference to DMSO control cells (p = 0.09). (h) Left panel, cumulative distribution function of the engulfment stage of randomly selected phagocytic events before completion of engulfment (n = 68 DMSO control and 55 SMIFH2-treated) from three independent experiments. Two sample Kolmogorov-Smirnov test revealed no significant difference. Right panel, fraction late-stage cups. Error bars indicate st.d. estimated by treating phagocytosis as a Bernoulli process. Fisher’s exact test was used to compare fractions (n.s.). (i) Sphericity and (j) constriction magnitude of DAAM particle is not affected by SMIFH2 treatment. Colored markers indicate individual events, black lines indicate averages of five bins. Right columns, violin plots of all events. Marker and line styles as in (e). Two-sided Wilcoxon rank sum test comparing with the DMSO control (gray) over the same bins revealed no significant differences. (k) SMIFH2 treatment reduces formation of actin-based teeth within the phagocytic cup. Teeth size and shape are not affected. *** indicates Wilcoxon rank sum test results comparing with the DMSO control with p < 0.001. All error bars indicate s.e.m. unless indicated otherwise. Raw data are available in Figure 3—source data 1 and Figure 4—source data 1.