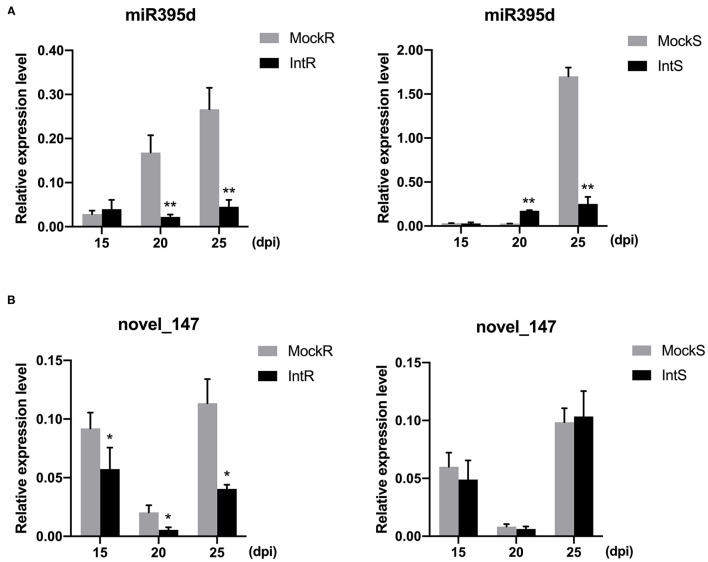
Figure 2.
Validation of the relative expression level of (A) miRNA395d and (B) novel_147 in 409R and 409S in response to P. brassicae infection. Y-axis, relative expression level; X-axis, days post-inoculation (dpi). Data were obtained from at least three biological replicates. Bars represent SD (STDEV). *p ≤ 0.05, **p ≤ 0.01 by Student's t-test. MockR, 409R without inoculation; IntR, 409R with inoculation; MockS, 409S, without inoculation; IntS, 409S with inoculation.

