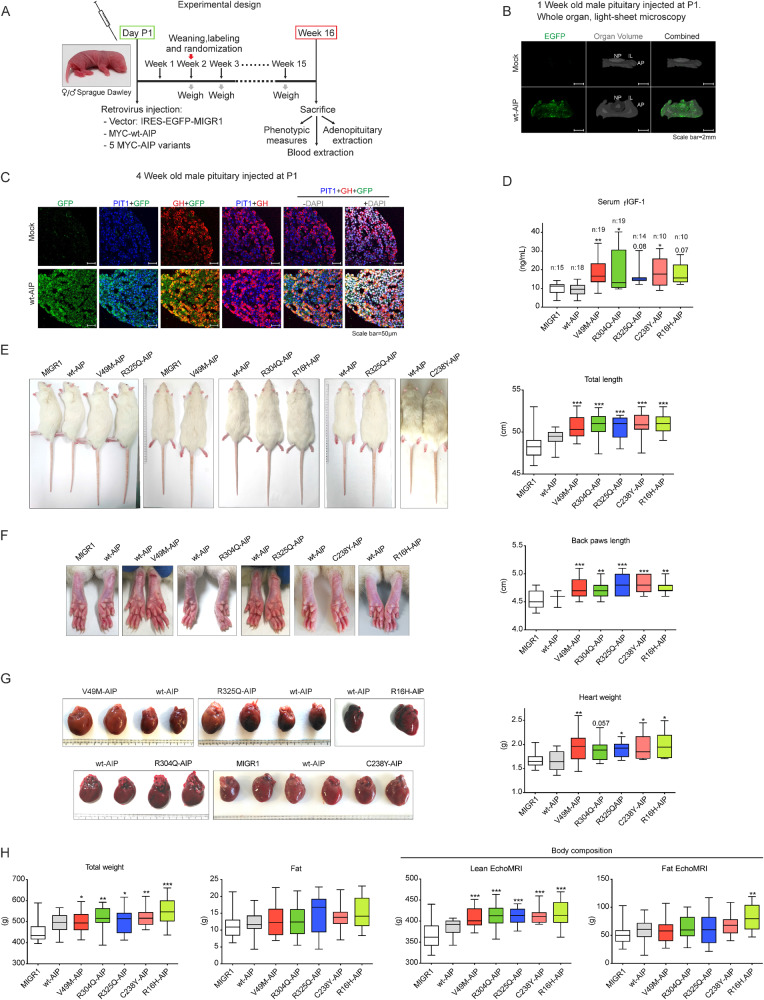
Fig. 5. AIP pathogenic mutations injected in the pituitary at birth and expressed in somatotrophs cause acro-gigantism in male rats.
A Chronogram of the model used to test the AIP variants. Retrovirus bearing the empty vector, or expressing wtAIP, or five different AIP variants (V49M, R304Q, R325Q, C238Y, R16H), followed by an IRES-EGFP expressing element were injected at the pituitary in postnatal day P1. Two weeks later, animals were randomized. Every week animals were weighed. Some animals were sacrificed 1 or 4 weeks after injection to study the pituitary gland, while others at week16, when biometric data, together with serum and organ weights, were collected. B 3D whole organ pituitaries clarified with X-Clarity and studied with light-sheet microscopy one week after the infection of mock virus or wtAIP-IRES-EGFP virus. Grey: whole organ volume (mock: coronal position respect to light-sheet; wtAIP: axial position respect to light-sheet). EGFP fluorescence is observed exclusively in the pituitary injected with wtAIP retrovirus throughout the whole organ. AP adenopituitary or adenohypophysis, IL intermediate lobe, N neuropituitary. C Somatotroph specificity was promoted by the use of retrovirus infecting the most proliferating cells at this period, that are the somatotrophs, and reinforced by combining the virus with GHRH and ghrelin neuropeptides inducing somatotroph proliferation. Paraffin sections of mock or wtAIP retrovirus infected four weeks old pituitaries showing confocal GFP (green) colocalization with PIT1 (nuclear, blue) and GH (red) in somatotroph cells. D Serum Free IGF-1 (FIGF-1) levels in the different groups of male rats showing that AIP variants but not wtAIP increased significantly and consistently with GH action at its primary target, the liver that secretes serum IGF-1. E Male rats infected with variant AIP were significantly longer, with longer tail (and longer body, shown in Supplementary Figure 7). F Soft tissues were enlarged in male animals bearing AIP variants in the pituitary. Significant differences were found for back and front paws and ears in rats injected with AIP variants. G AIP variants induced cardiomegaly. H Left: Total body weight was increased but total fat mass presented no differences. Right: Body composition was assessed by EchoMRI. AIP variants significantly increased lean mass, while fat mass was not affected except for R16H. (One-way ANOVA with Dunnett’s test multiple comparison test correction D-E-F-G-H. *, p < 0.05; **, p < 0.01; ***, p < 0.001; numbers, when p is non-significant but is small).

