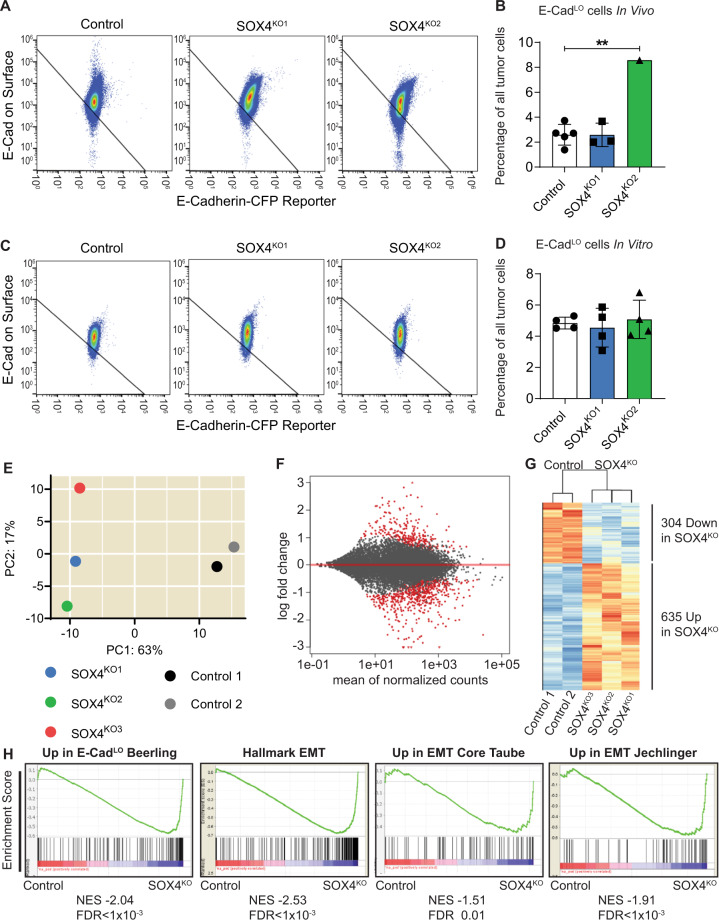
Fig. 2. Loss of SOX4 does not induce a loss of EMT.
A FACS plots to determine E-CadLO cells by FACS in tumors. Tumors were isolated and subjected to a FACS protocol as described in materials and methods. FACS plots show E-cadherin antibody staining on Y-axis and E-cadherin CFP-reporter expression on X-axis. E-CadLO cells are found in the left-bottom gate. Plots are representative pictures for each of the three groups (control, SOX4KO1, SOX4KO2). B Quantification of E-CadLO cells for control and SOX4KO tumors shown as percentage of parental population (single cells). Data is represented as average ± SD. ANOVA using Dunnett test for multiple comparisons indicated non-significant differences (p > 0.05) of SOX4KO1 and **p < 0.01 for SOX4KO2. C FACS plots of E-CadLO cells in organoids in vitro in similar analysis as 2(A). Plots for each of the three groups (control, SOX4KO1, SOX4KO2) are representative pictures corresponding to one experiment. Experiment was performed four times. D Quantification of E-CadLO cells for control and SOX4KO organoids in vitro shown as percentage of parental population (all single tumor cells). Data is represented as average ± SD. ANOVA using Dunnett test for multiple comparisons indicated non-significant differences (p > 0.05) of SOX4KO lines compared to control. E Principal Component Analysis of three SOX4KO organoid lines and two control organoid lines. F Differential gene expression analysis between control and SOX4KO organoids lines. Gray dots indicate genes; red dots indicate significant genes (adjusted p-value < 0.1). G Heatmap showing differentially expressed genes between control and SOX4KO organoids. 304 genes are significantly downregulated and 635 genes are significantly upregulated in SOX4KO organoids. H Gene-set enrichment analysis (GSEA) representing the enrichment of four different EMT gene sets ([8], Hallmark EMT in GSEA [42, 43]) in the bulk RNA-seq expression dataset.

