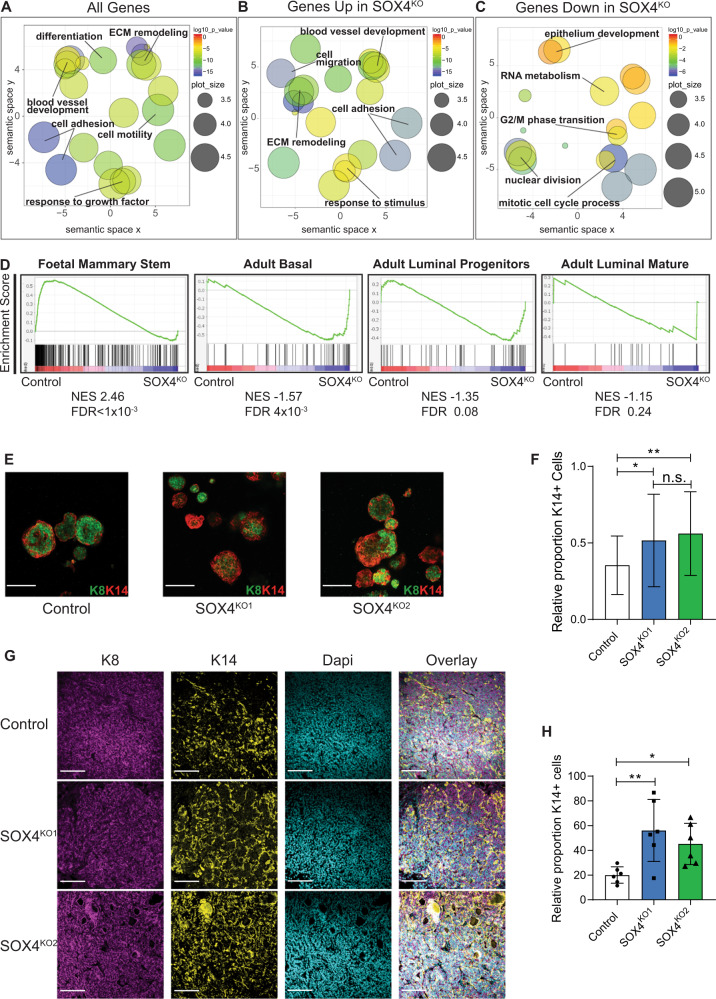
Fig. 3. Loss of SOX4 is associated with an increase in mammary differentiation.
A GO-term analysis of all differentially expressed genes. GO-terms are visualized by REVIGO to summarize similar GO-terms [44]. B GO-term analysis of 635 significantly upregulated genes in SOX4KO organoids. C GO-term analysis of 304 significantly downregulated genes in SOX4KO organoids. D GSEA comparing genes differentially expressed in SOX4KO organoids to gene sets specific for fetal mammary stem cells, adult mammary basal cells, adult mammary luminal progenitors and adult mammary luminal mature cells (derived from [26]). E Confocal images of immunostaining for luminal marker K8 (green) and basal marker K14 (red) on organoids in vitro. F Quantification of proportion of organoids that exhibits predominantly K14 staining. Data is represented as average ± SD. ANOVA using Dunnett test for multiple comparisons was used to calculate p-values (n.s. = non-significant, *p < 0.05, **p < 0.01). Scale bar is 100 µm. G Confocal images of immunostaining for luminal marker K8 (magenta) and basal marker K14 (yellow) and DAPI (Cyan) on paraffin sections of lung metastases. Scale bar is 100 µm. H Quantification of K14-positive cells as a proportion the K8-positive cells, which make up all tumor cells. Data is represented as average ± SD. ANOVA using Dunnett test for multiple comparisons was used to calculate p-values (*p < 0.05, **p < 0.01).

