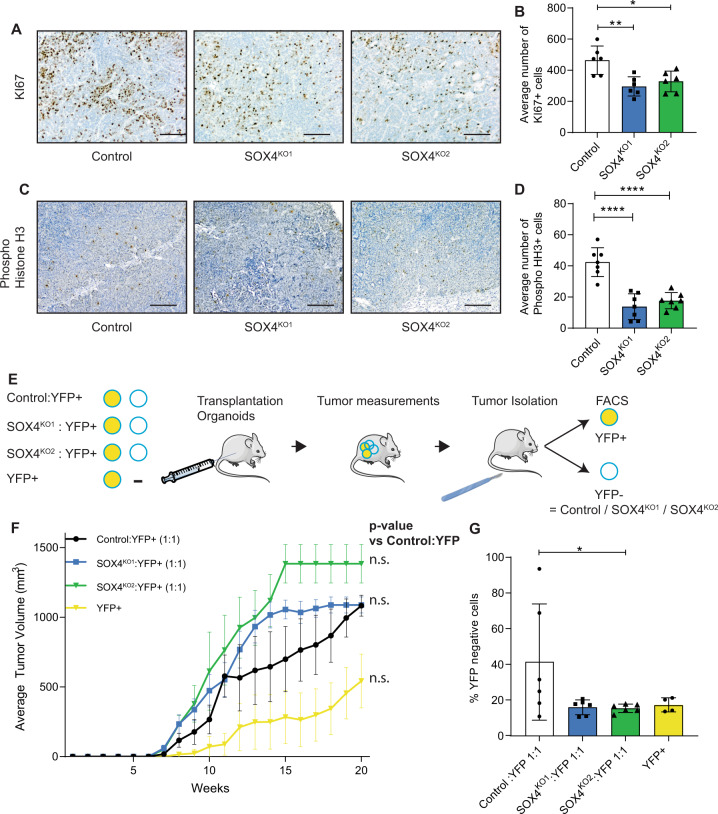
Fig. 5. SOX4 is required for tumor proliferation in a cell-autonomous manner.
A Ki67 staining on paraffin sections of lung metastases. Scale bar is 100 µm. B Quantification of Ki67+-cells in control and SOX4KO tumors in lungs. Data is represented as average ± SD. ANOVA using Dunnett test for multiple comparisons was used to calculate p-values (*p < 0.05, **p < 0.01). C Phospho-Histone H3 (Ser10) staining on paraffin sections of lung metastases. Scale bar is 100 µm. D Quantification of phospho-Histone H3-positive cells in control and SOX4KO tumors in lungs. Data is represented as average ± SD. ANOVA using Dunnett test for multiple comparisons was used to calculate p-values (****p-value < 0.0001). E Schematic representation of experimental setup for cell competition assay. Organoid mixtures were transplanted orthotopically in mammary fat pads of recipient mice. Mixtures consisted of 50% YFP + organoids and 50% of indicated organoids (control, SOX4KO1, SOX4KO2) or unmixed YFP + organoids. Tumor growth was measured over time. Mice were sacrificed when tumor volume reached 1000 mm3 and tumors were subjected to FACS to determine the percentage of YFP + and YFP- cells. F Growth curves for tumors after mammary transplantation of indicated mixtures of organoids. Data are represented as mean tumor volume (mm3). P-values were determined to be non-significant (> 0.05) by the “compare growth curves” method [41]. G Quantification of YFP negative cells (% of all tumor cells) as determined by flow cytometry for YFP on tumors.

