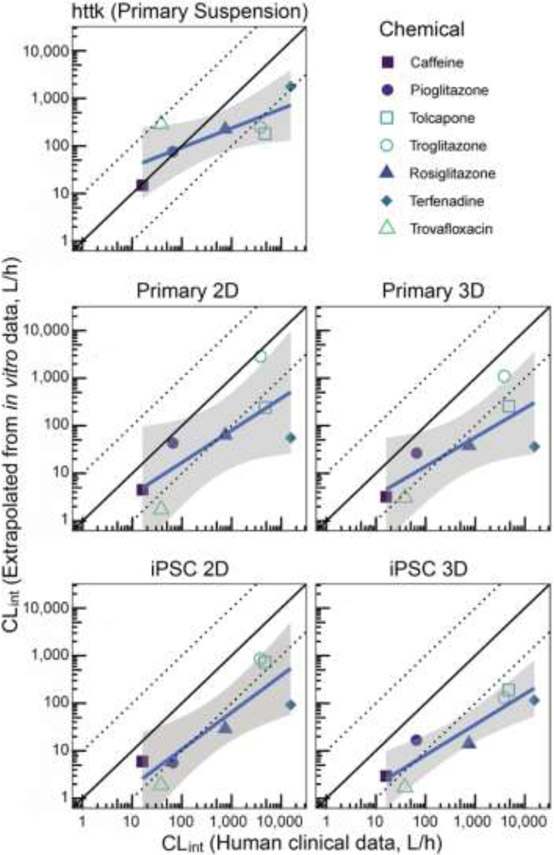
Figure 3.
Correlation between intrinsic hepatic clearance from clinical in vivo data and from each in vitro system. Symbols represent the mean for each chemical and data source. Solid black line is 1:1 line, and dotted lines represent 10-fold over- and under-prediction. The solid blue line and shaded region represent the linear fit and confidence interval (on log-transformed values) (see Table 2 for summary statistics).

