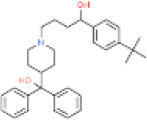
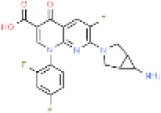
Table 1.
Selected properties of tested chemicals
| Name | Structure | CAS# | cLogP | Fub, plasma* |
Fub, media† |
Hepatocyte metabolism | Literature oral clearance* |
Intrinsic hepatic clearance‡ |
|---|---|---|---|---|---|---|---|---|
| Caffeine |

|
58-08-2 | −0.54 | 0.51-1.0 | 1.0 | CYPA2, xanthine oxidase, or N-acetyltransferase 2 | 8.7 L/hr | 16.1 L/hr |
| Pioglitazone |

|
111025-46-8 | 0.425 | 0.008-0.04 | 0.19-0.34 | CYP2C8, CYP3A4, and conjugation with sulfate or glucuronic acid | 2.5 L/hr | 66.0 L/hr |
| Rosiglitazone |
|
122320-73-4 | 0.461 | 0.0016-0.036 | 0.14-0.18 | CYP2C8, CYP2C9, N-demethylation, and conjugation with sulfate or glucuronic acid | 2.85 L/hr | 746 L/hr |
| Troglitazone |

|
97322-87-7 | 1.941 | 0.0009-0.017 | 0.03-0.05 | CYP3A4, and conjugation with sulfate or glucuronic acid | 36.8 L/hr | 3830 L/hr |
| Terfenadine |

|
50679-08-8 | 5.206 | 0.003-0.022 | 0.46-1.0 | CYP3A4, CYP2D6 | 4390 L/hr | 15500 L/hr |
| Tolcapone |

|
134308-13-7 | 3.367 | <0.001-0.029 | 0.04-0.11 | Conjugation with glucuronic acid | 6.64 L/hr | 4730 L/hr |
| Trovafloxacin |

|
147059-72-1 | 0.96 | 0.188-0.37 | 0.93-1.0 | N-Acetylation, and conjugation with glucuronic acid | 8.28 L/hr | 38.2 L/hr |
Representative range of literature-reported values (see Methods).
Range of values for primary vs. iPSC hepatocyte media
As described in Methods, converted from oral clearance adjusting for free fraction under a parallel tube model; also adjusted for incomplete absorption (pioglitazone) or renal clearance (trovafloxacin).
