
FIGURE 1:
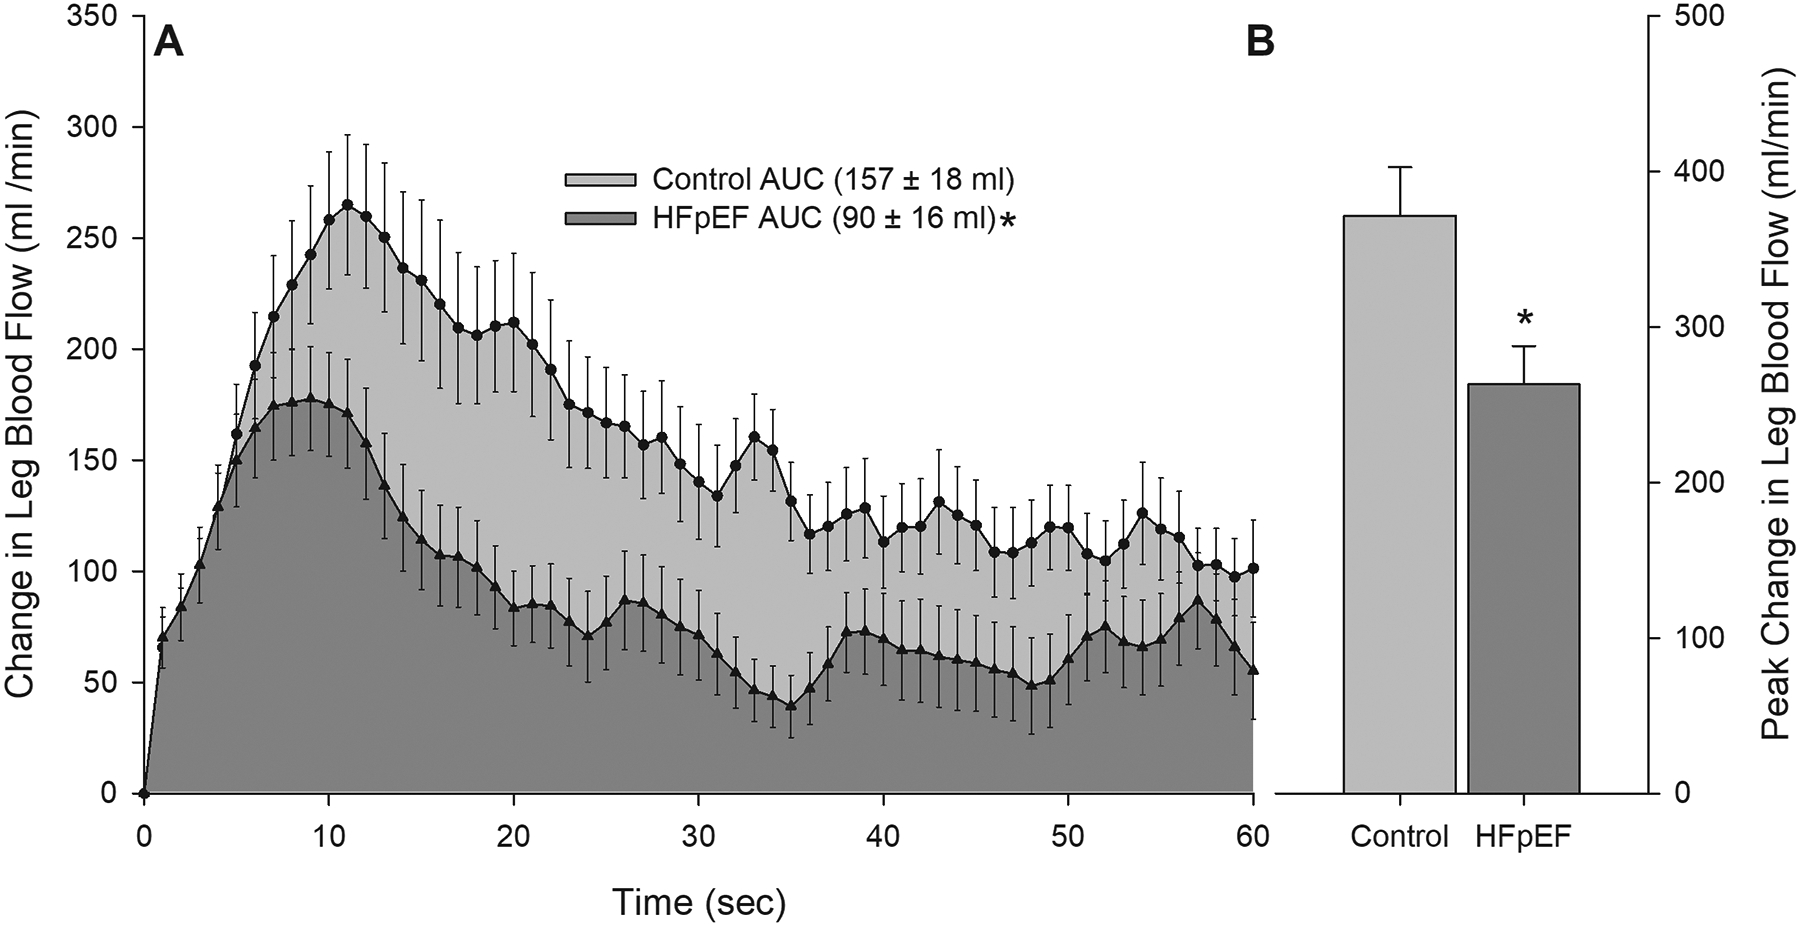
Panel A: Changes in leg blood flow during 1 minute of passive leg movement in controls and patients with HFpEF. Area under the curve (AUC) was calculated as the summed second-by-second values during passive movement. Panel B: Peak change in leg blood flow achieved during 1 minute of passive leg movement in controls and patients with HFpEF. *Significantly different than control, P < 0.05. HFpEF n = 43; Control n = 39. Data are mean ± SEM