
FIGURE 4:
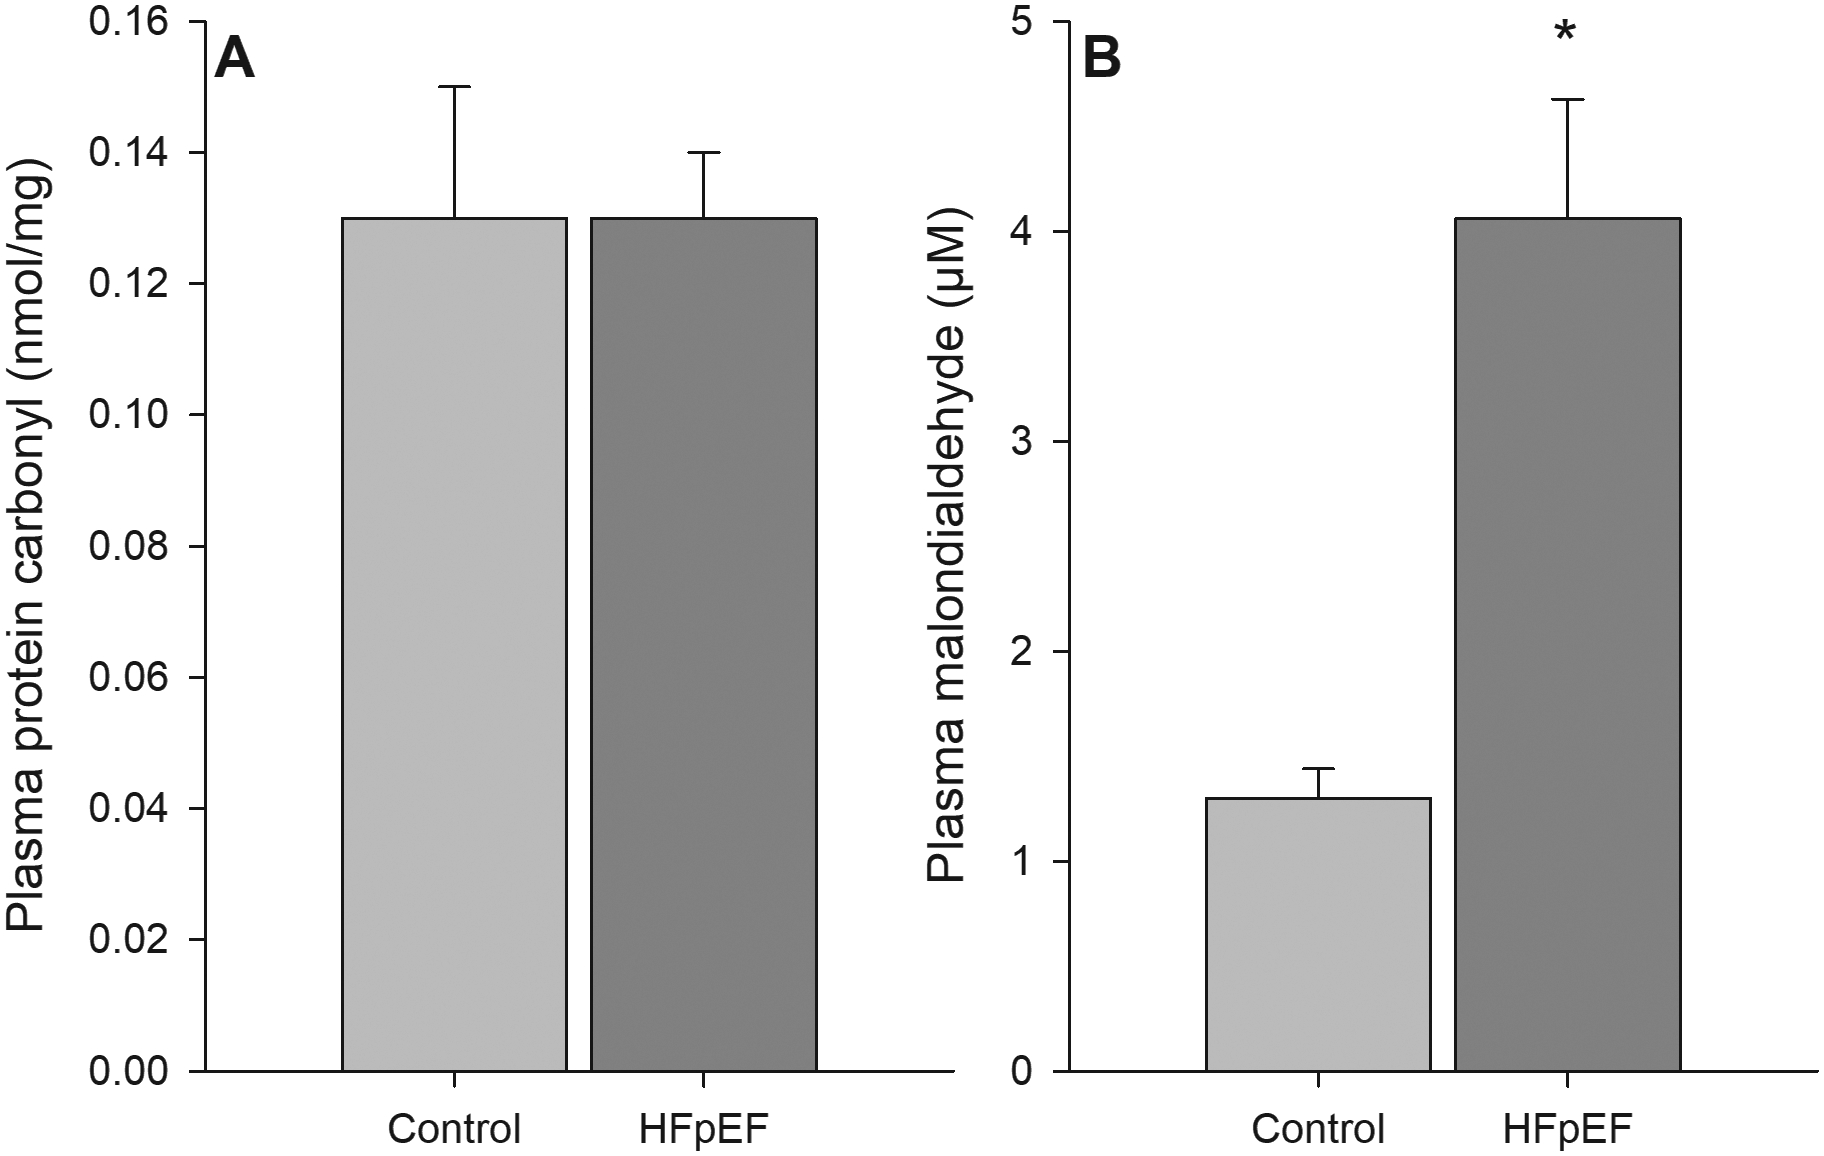
Serum biomarkers of oxidative damage, as assessed by protein carbonyl (panel A, HFpEF n = 26; Control n = 33) and malondialdehyde (panel B, HFpEF n = 27; Control n = 35) in controls and patients with HFpEF. * Significantly different than control, P < 0.05. Data are mean ± SEM