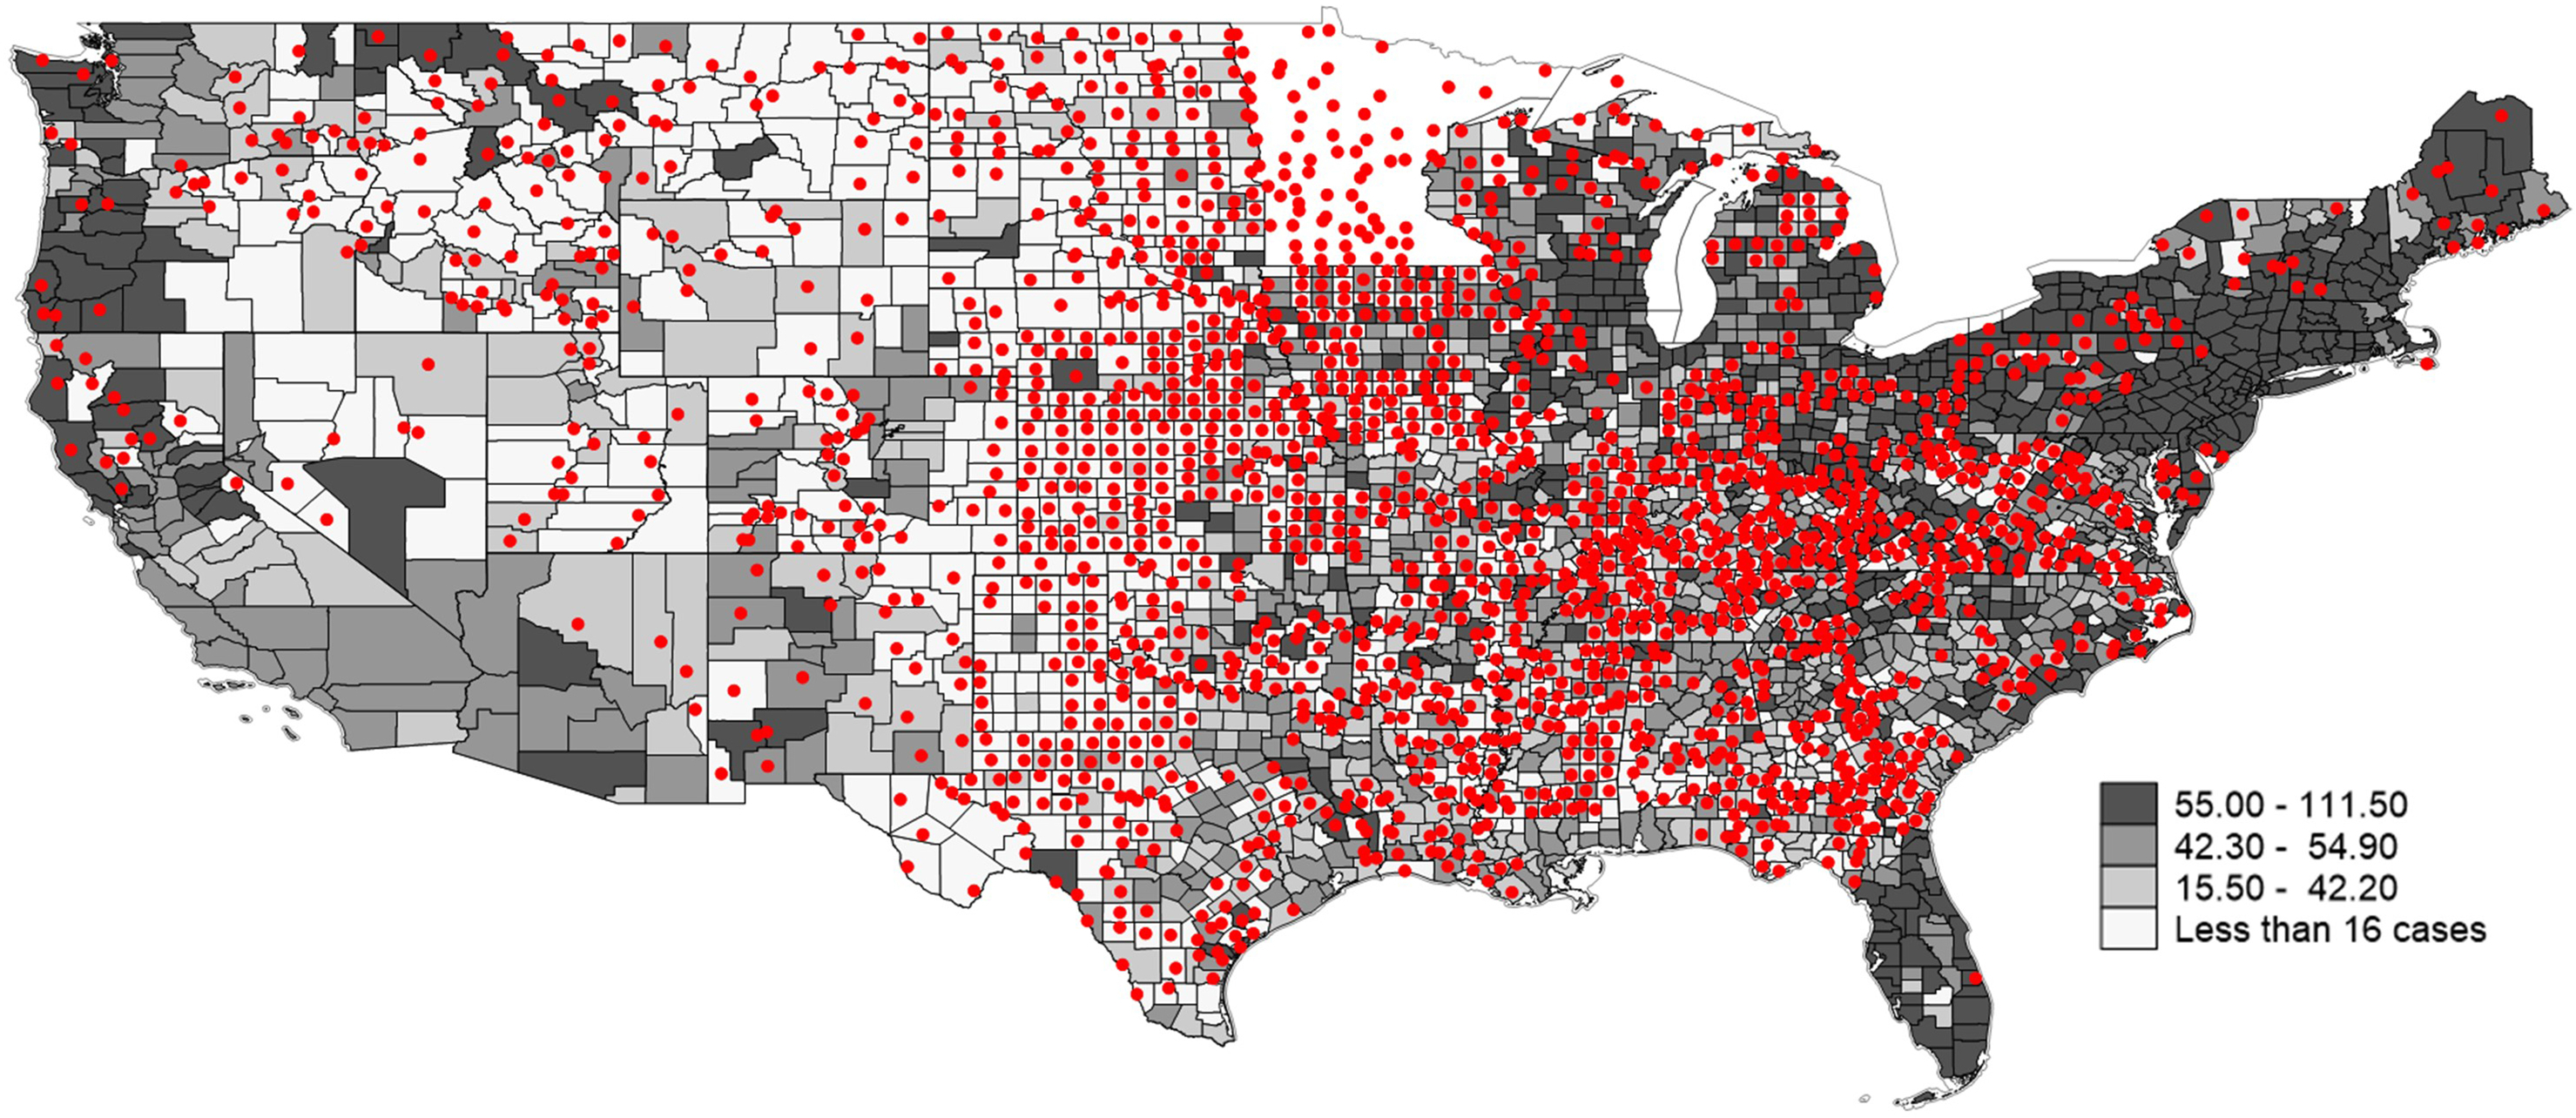
Figure 4:

U.S. Counties without Gynecologic oncologists in the Home and Adjacent Counties and Gynecologic Cancer Rates (in Quantiles) Footnote: Rates represent annual incidence of gynecologic cancer per 100,000 women. ‘Less than 16’ category represents two lowest quintiles. Source: 2013–2017 U.S. Cancer Statistics (17).
