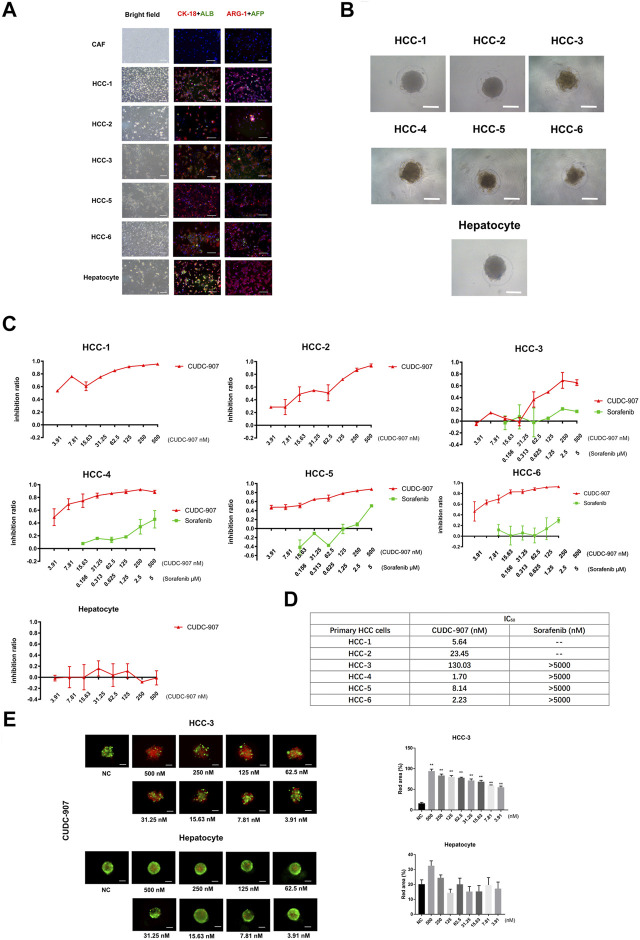
FIGURE 2.
The drug sensitivity test of primary cell spheroid. (A) AFP, albumin, ARG-1 and CK-18 immunostaining of primary cells to examine the cellular origin of primary cells. (B) Primary cells cultured in our novel 3D culture device for 3 days. (C) Inhibitory curve of CUDC-907 and sorafenib on primary cell spheroid. Primary cell spheroids were treated with CUDC-907 and sorafenib for 3 days. (D) The IC50 of CUDC-907 and sorafenib on primary HCC spheroids. (E) Calcein-AM/propidium iodide staining of primary cell spheroids. The primary cells were treated with CUDC-907 for 3 days. Scale bar = 200 μM. *p < 0.05, **p < 0.001 (result compares with NC group).

