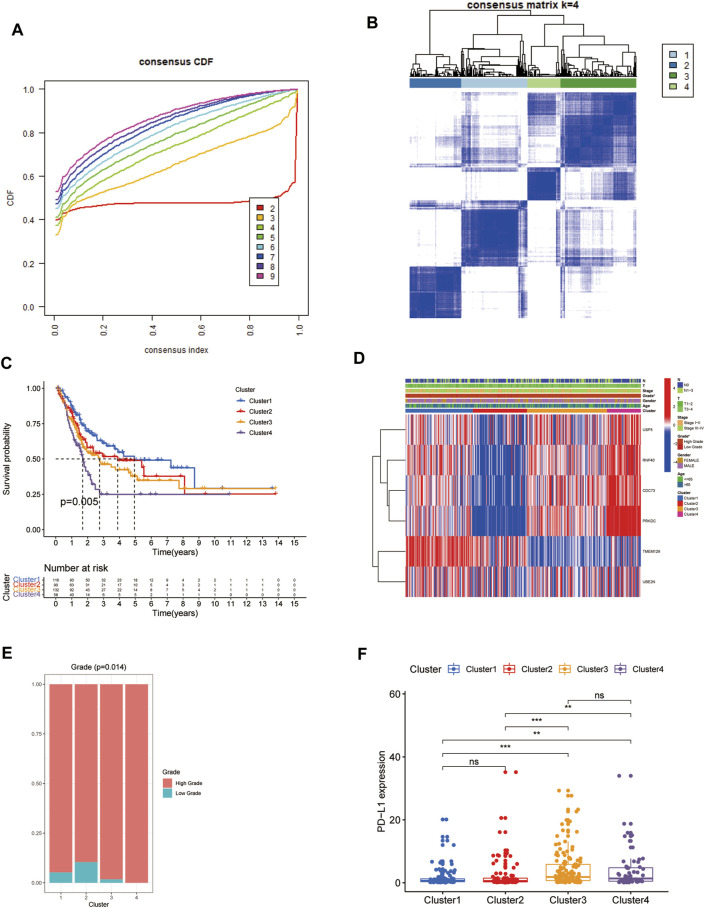
FIGURE 2.
Identification of four ubiquitination-related molecular subtypes of BCa using consensus clustering analysis (A, B). Comparison of overall survival among these four subtypes (C). The correlation heatmap between this ubiquitination-related molecular subtypes and clinicopathologic features (D). The difference of grade (E) and the expression level of PD-L1 among these four subtypes (F). *p < 0.05; **p < 0.01; ***p < 0.001.

