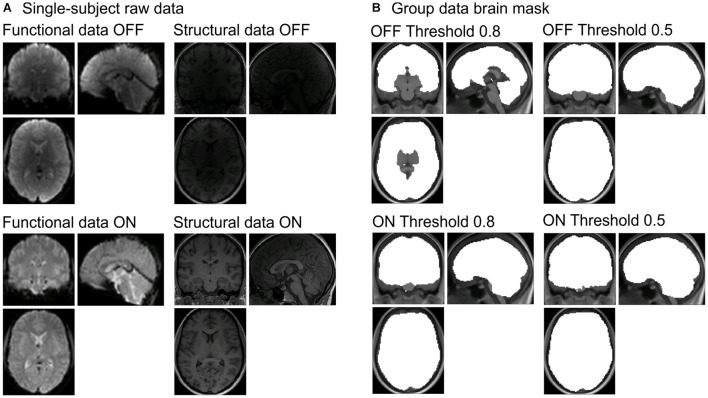
FIGURE 1.
(A) Raw data for functional (left column) and structural data (right column) with the prescan normalize filter OFF (first row) and ON (second row) from one participant. (B) Differences in brain masks for the different masking thresholds (0.8 = original in left column and 0.5 = adjusted in right column) between prescan normalize OFF (first row) and ON (second row). Brain masks are created during the whole-brain analyses with SPM. SPM, Statistical Parametric Mapping.

