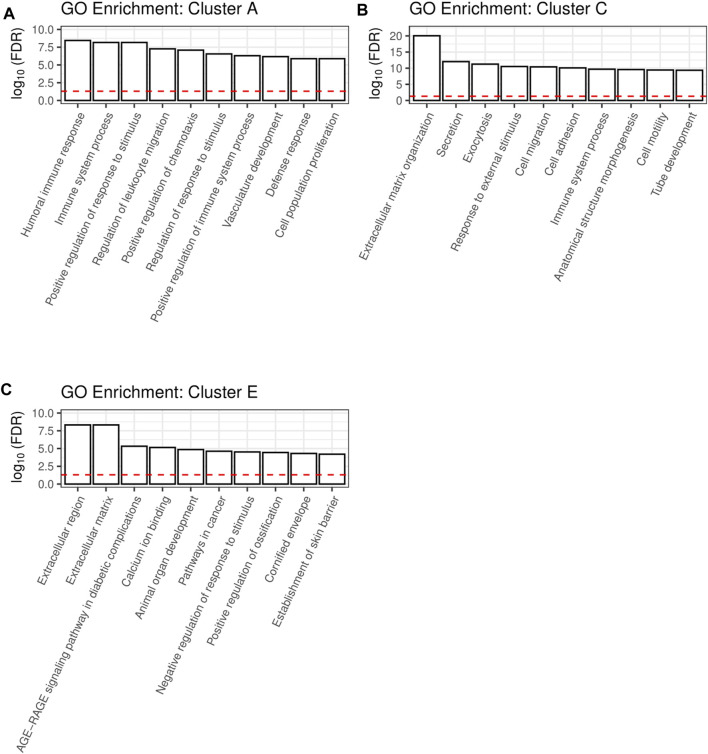
FIGURE 3.
A shiny GO enrichment analysis for the previously defined cluster A (A), cluster C (B) and cluster E (C) was performed. Redundant pathways were reduced to show only one representative pathway. Depicted is the −log10(FDR) of the top 10 pathways for each cluster. The red dashed line indicates the significance threshold.

