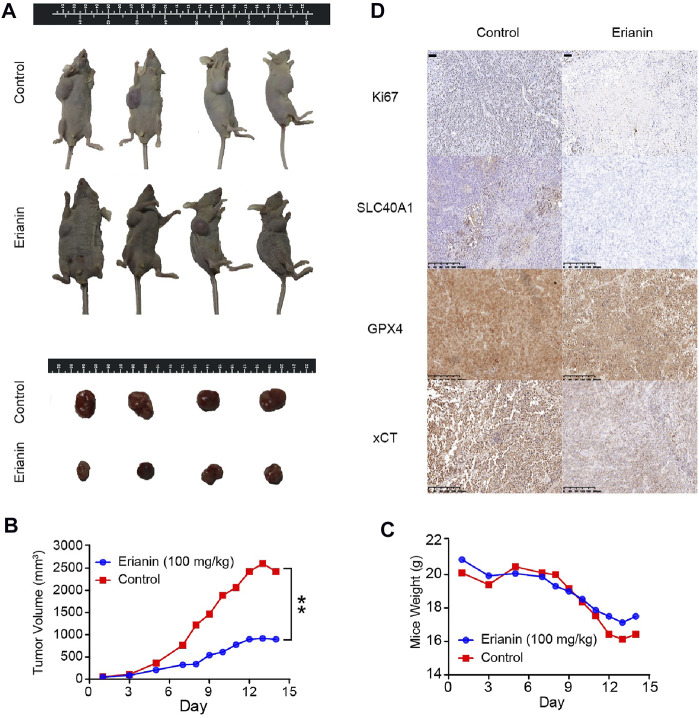
FIGURE 4.
Erianin suppressed tumor growth by inducing ferroptosis in vivo. (A) Representative image of mice and xenograft tumors at the endpoint of experiment. (B) The average tumor volume from different groups. Values are shown as mean ± SD, **p < 0.01. (C) The average mice weight from different groups. Values are shown as mean ± SD. (D) The expression of Ki67, GPX4, SLC40A1 and xCT were detected by IHC.

