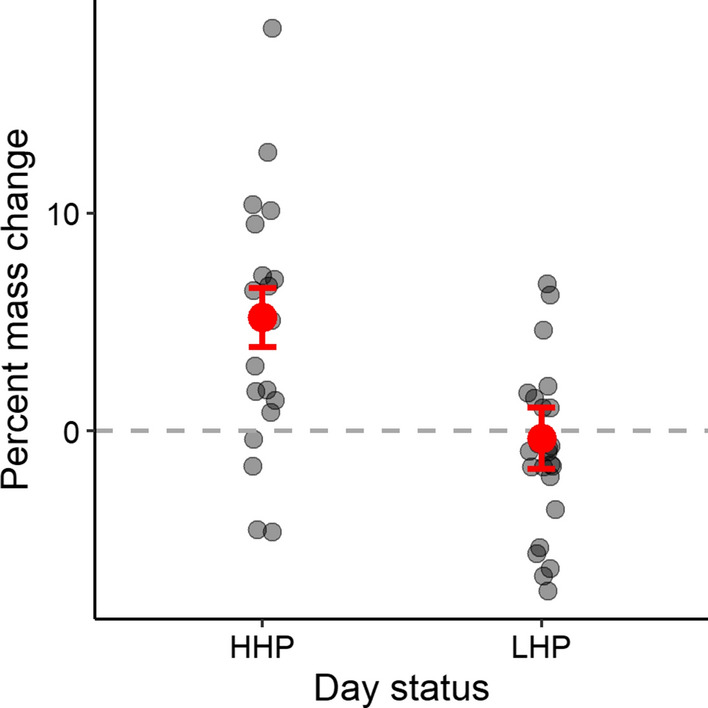
Fig. 3.

Adult red-winged starling daily % mass change on high human presence (HHP) and low human presence (LHP) days. Percentage mass change within the same colour-marked individuals was, on average, positive on HHP days (model-averaged mean = 5.22% ± 1.35%) but zero-to-negative on LHP days (model-averaged mean = − 0.37% ± 1.53%). Data collected on 20 HHP and 23 LHP days, respectively. n = 16 adult starlings from 9 nest attempts. Error bars represent one standard error around the mean
