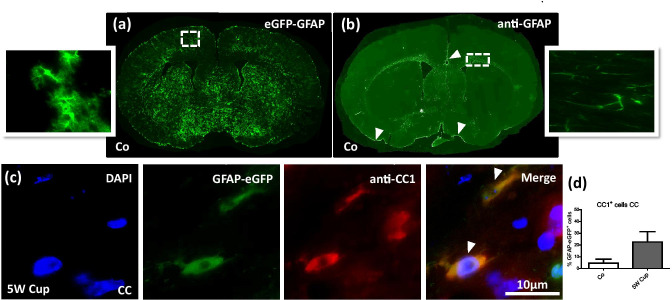
Fig. 2.
Comparison of eGFP-GFAP expression and anti-GFAP immunostaining in control and after cuprizone intoxication. (a), (b) The distribution of eGFP-GFAP+ cells and anti-GFAP+ cells in the brain of a control mouse (Co). Higher magnification images are taken from the cortex and lateral part of the corpus callosum. The star indicates the anterior commissure, arrowheads highlight the brain surface (i.e., glia limitans superficialis). (c) Immunofluorescence labeling of anti-CC1 (red) in eGFP-GFAP (green) transgenic mice. In total, three to four animals per group were processed; two independent experiments were performed. Arrowheads indicate co-localization of anti-CC1 and eGFP-GFAP signals. (d) The quantification of eGFP-GFAP GFAP and anti-CC1 cells in the corpus callosum (CC). Scale bar = 10 µm

