Fig. 3.
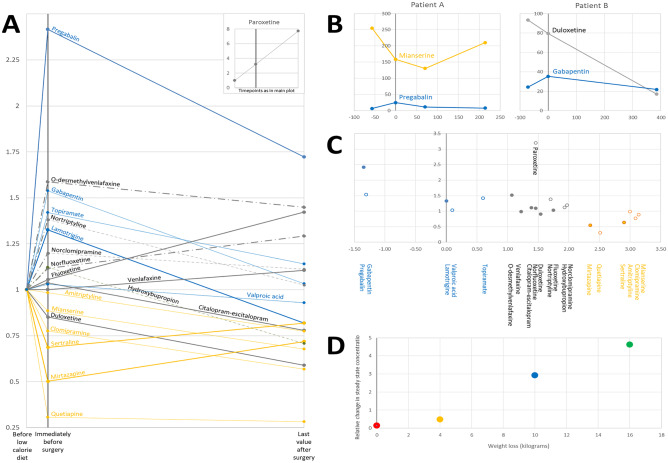
Relative change in dose-adjusted steady state concentration for highly hydrophilic substances (blue, logD at pH 7.4: < 1) and highly lipophilic substances (yellow, logD at pH 7.4: > 2) over the low-calorie diet and post-surgery periods (A), within the same patient (B), and over the low-calorie diet period (C), and for the highly hydrophilic substance pregabalin over the low-calorie diet period plotted against the weight loss (D). In A, values are expressed as the arithmetic means of the immediate (0–3 day) pre-surgery values (normally at the very end of the low-calorie diet), and 1-year (≥ 300 day) post-surgery values, respectively; both first divided by the baseline (pre-low-calorie diet) value for the particular patient (dashed lines = metabolites; thin lines = n < 4; bold lines = n ≥ 4). For paroxetine, quetiapine, and valproic acid, post-surgery concentrations at ≥ 300 days were not available. For these patients, the last post-surgery observation at 57, 182, and 220 days, respectively, was carried forward. In B, data from Fig. 2 from two patients (A and B) are merged to illustrate that hydrophilic and lipophilic drugs are affected differently by a low-calorie diet within the same patient (X axis, days before and after surgery; Y axis, nmol/L (mianserine, duloxetine) or µmol/L (pregabalin, gabapentin). In C, values are expressed as the arithmetic mean of immediate pre-surgery (normally sampled at the very end of the low-calorie diet) values, divided by their corresponding baseline (pre-low-calorie diet) values, plotted against the logD value of the drug at pH 7.4. In D, values are expressed as immediate pre-surgery (normally at the very end of low-calorie diet) values divided by their corresponding baseline (pre-low-calorie diet) values, and individuals are shown in same colours as in Fig. 2

