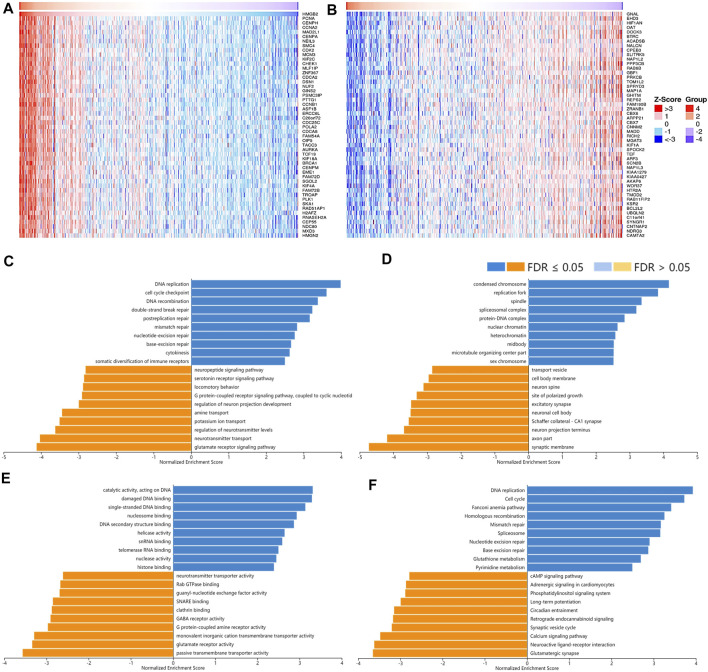
FIGURE 8.
The correlated genes of High Mobility Group Box 2 (HMGB2) in LGG and GSEA results. The top 50 genes significantly (A) positively and (B) negatively correlated with HMGB2 in LGG (LinkedOmics). The top 20 significantly enriched (C) GO-BP, (D) GO-CC, (E) GO-MF, and (F) KEGG pathway terms of HMGB2 correlated genes based on GSEA. A bar represents a normalized enrichment score for a term, which in orange or blue represents negatively or positively enriched respectively.

