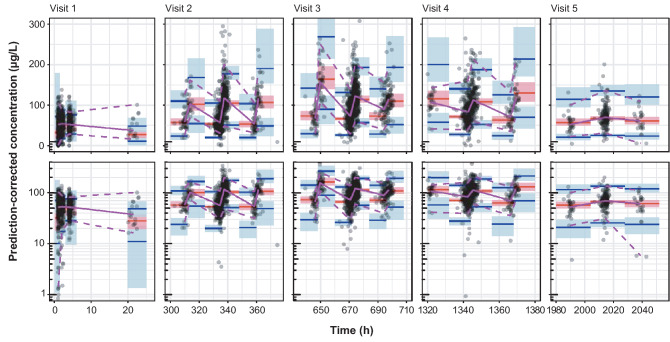
Fig. 2.
Prediction-corrected visual predictive checks of the final covariate model at visits 1–5. The upper row shows the normal scale and the lower row shows the log scale of the prediction-corrected concentrations. In Visits 2–5, time is shown ± 24 h around the planned time. Solid purple line: median prediction-corrected data. Dashed purple lines: 90% prediction interval of prediction-corrected data. Solid red line: median model predictions. Solid blue lines: 90% interval. Boxes indicate the 95% confidence intervals around the corresponding model predictions. Circles: prediction-corrected observed vericiguat plasma concentration–time data

