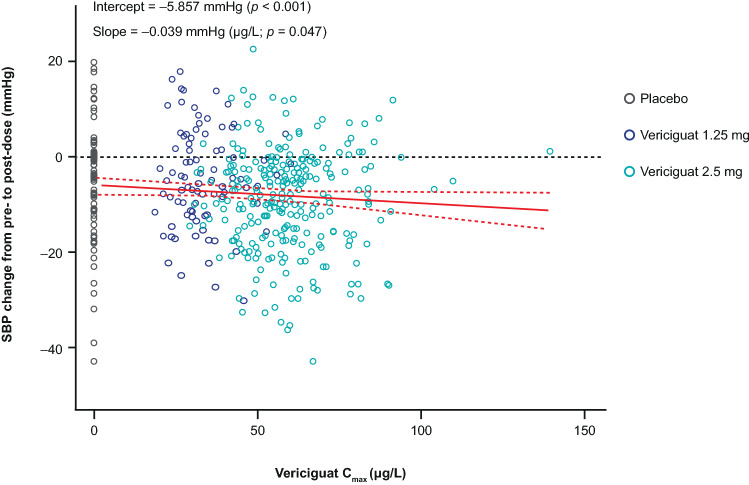
Fig. 3.
Systolic blood pressure (SBP) change vs vericiguat maximum observed concentration (Cmax). Correlation of Cmax with change in SBP from pre-dose to post-dose (first dose of study medication) at visit 1. Open symbols represent data from individual patients belonging to different treatment arms (black: placebo, dark blue: 1.25 mg, teal: 2.5 mg). The red solid line depicts the linear regression model. The 95% confidence interval (CI) of the regression model is represented by red dashed lines

