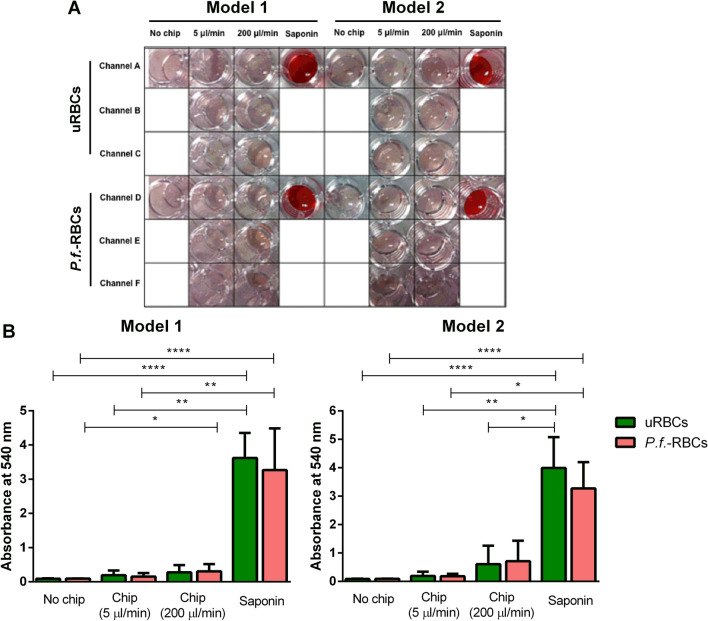
Figure 4.
Hemolysis quantification of RBCs after passage through the microdevices. (A) Different conditions of the hemolysis assay with a picture of the 96-well plate containing the supernatants of the different samples. Data correspond to one representative experiment. (B) Hemolysis quantification of RBCs. Plots show the mean and the standard error of supernatant absorbance values of uRBCs and P.f.-RBCs that passed through model 1 and model 2. Data correspond to all experiments performed through the study. Statistical significance was determined using the Kruskal–Wallis test. Dunn's multiple comparisons test showed the following results (****p ≤ 0.0001; ***p ≤ 0.001; **p ≤ 0.01; *p ≤ 0.05).

