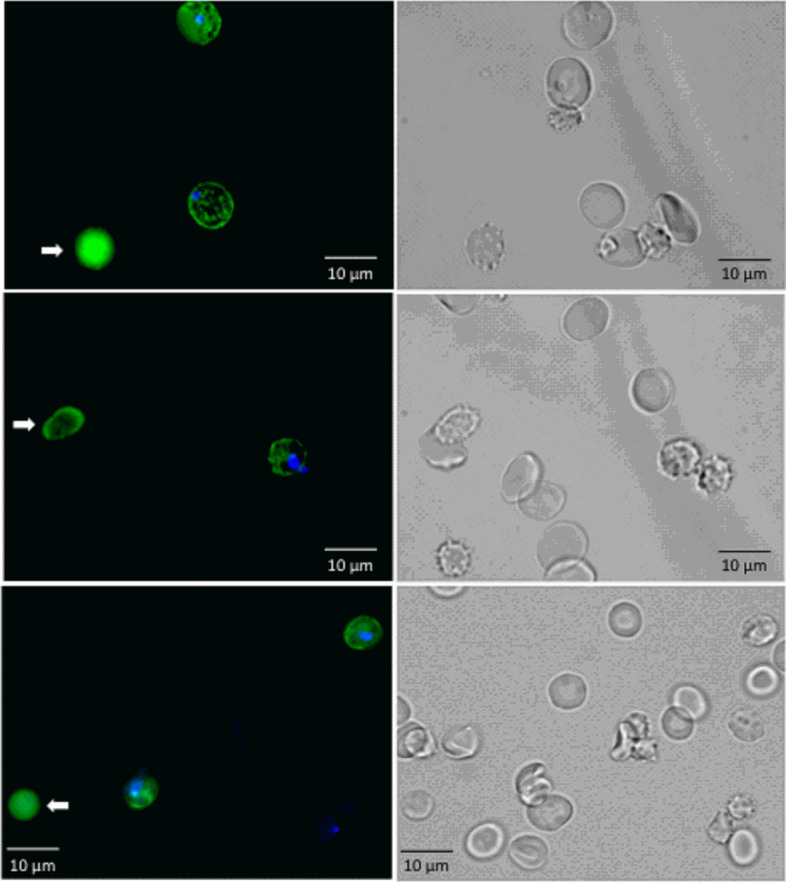
Figure 5.

Fluorescence microscopy images of P.f.-RBCs after passing through the microfluidic devices (left column). Infected cells are shown as DAPI+ RESA+ (blue and green). White arrows indicate pitted cells (DAPI-RESA+, green). Corresponding bright field images of the same fields are shown in the right column. The images were obtained with an epifluorescence microscope (Leica AF6000) and modified using ImageJ software (version 1.41n Wayne Rasband, NIH, (https://imagej.nih.gov/ij/).
