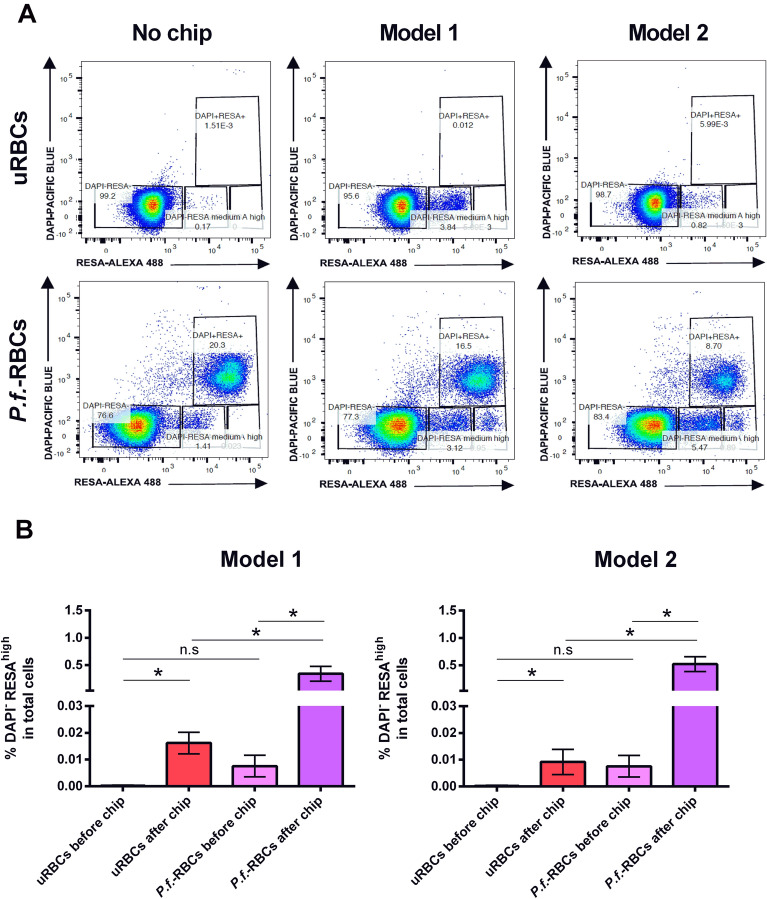
Figure 6.
Flow cytometry-based pitting quantification. uRBCs and P.f.-RBCs were collected and analyzed by flow cytometry before and after passing through the microfluidic devices. Cells were gated according to the strategy described in Supplementary Fig. S3. (A) Representative dot plots of uRBCs (DAPI-RESA-), autofluorescent uRBC (DAPI-RESAmedium), P.f.-RBCs (DAPI+RESA+), O-iRBCs (DAPI-RESAhigh) before (No chip) and after passing through microfluidic device models 1 and 2. This figure corresponds to one experiment out of seven. Twelve devices were used in each experiment (six of model 1 and six of model 2). (B) Frequencies of DAPI-RESAhigh cells from model 1 and model 2 between uninfected and infected cells before and after passing through the devices were compared. Data represent the mean and standard error of the mean obtained from seven independent experiments. Statistical significance was assessed by a t test with Wilcoxon signed-rank post-test, being considered statistical significance (*p value < 0.05).

