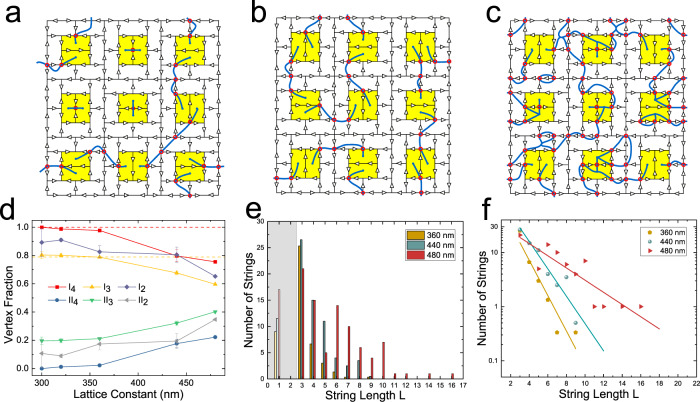
Fig. 3. Thermal annealing experimental results.
a–c Examples of moment configurations for small portions of the arrays measured after annealing, with both the moments and strings represented for samples with lattice constants of 360 nm, 320 nm, and 480 nm, respectively. Additional raw MFM data are given in Supplementary Note 3. d The vertex fractions observed after annealing as a function of lattice constant (error bars represent standard deviations of the data). With decreasing lattice constant, i.e., increasing interactions, the fractions converge to those expected for the disordered string ground state. Dashed lines are the expected vertex fraction of I4 and I3 for the disordered string ground state. e The distribution of string lengths for different lattice constants where the grey section covers those strings that are connecting only contiguous interior plaquettes and therefore are expected to have a different energy scale. We estimate the uncertainty in these values to be approximately 10–15%, based on the number of strings in the images. f The data from (e) plotted on a semi-logarithmic scale with exponential fits as described in the text.

