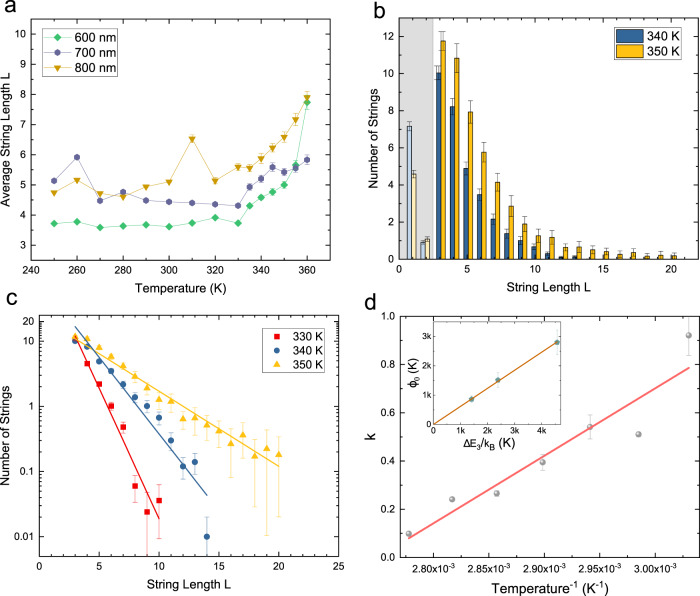
Fig. 4. String statistics from XMCD-PEEM data.
a The average length of strings as a function of temperature from the XMCD-PEEM data (measured in numbers of unhappy vertices). Note that the average string length is flat below T ≈ 330 K, indicating that the system falls out of thermal equilibrium. b The distribution of strings with various length for the a = 600 nm lattice, averaging over approximately 80 images (see Methods section). The grey section covers those strings that are connecting only contiguous interior plaquettes and therefore are expected to have a different energy scale. c The distribution of string length with a fit to a Boltzmann distribution p(L) e−Lk as described in the text. The error bars in panels (a–c) represent the standard errors of the data taken at each temperature. d The fitted k from the Boltzmann distribution as a function of inverse temperature for a = 600 nm and 330 K ≤ T ≤ 360 K shows a linear dependence on the inverse temperature, k(T) = ϕ0/T − ϕ1. Inset: the fit parameter ϕ0 as a function of [ΔE3/kB] computed from micromagnetics for all three samples, where the error bars are the standard errors of the fit parameters.

