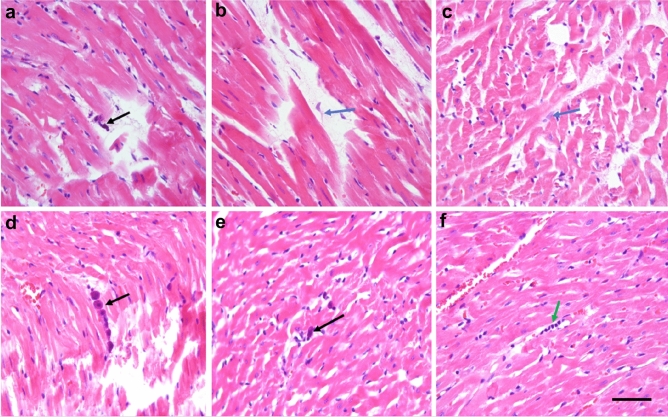
Figure 1.
Optical microscopy images of anomalies in heart tissues of rats from high sodium diet group (images a–c) in comparison with tissues of control animals (images d–f). Black arrow in image a shows a degranulated plasmocyte, while blue arrows in images (b) and (c) mark macrophages in the interstitium. In images (d) and (e) one can see also non-granulated mast cells (black arrows). Lymphocytes are marked in image (f) by green arrow. All sections are stained by hematoxylin and eosin. The scale bar for all the images is 150 μm.

