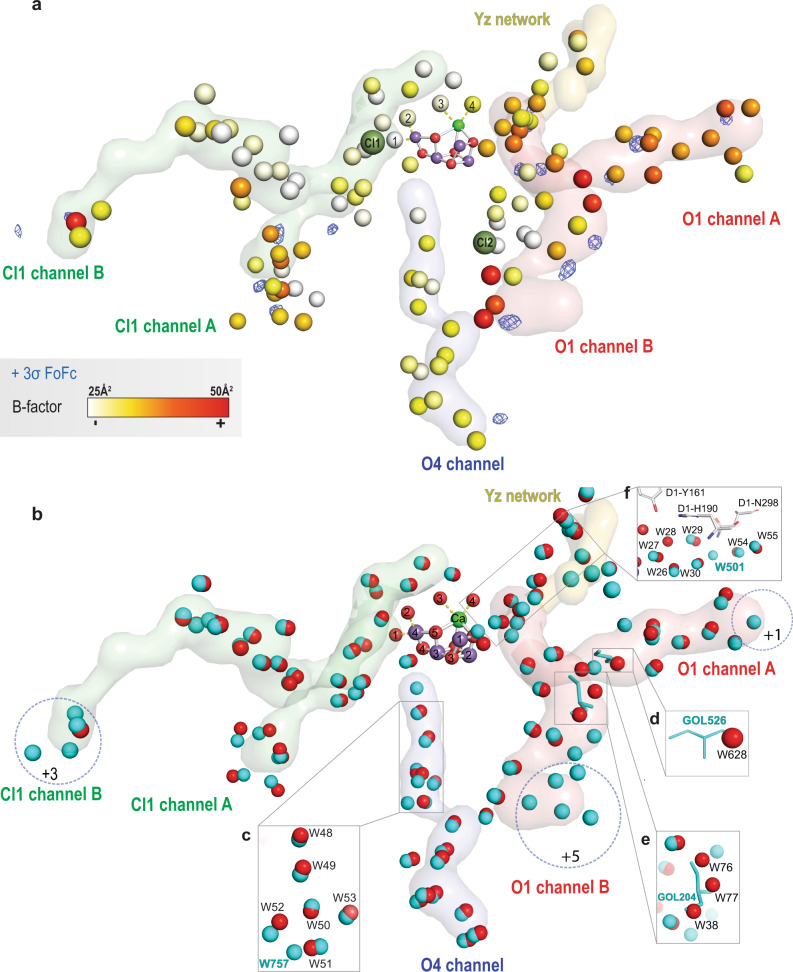
Fig. 2. Water channels in the 1.89 Å resolution RT structure.
a Fo-Fc, electron density omit map, contoured at ≥ +3σ in blue for all the proposed water channels. The water molecules are represented using a color gradient scale, representing the B-factor of each water (white color for B-factor 25 to red color for B-factor 50). The channels and the network, O1 Channel in red, O4 Channel in blue, Cl1 Channel in green, and Yz network in yellow. b Comparison between water channels in the RT and cryo structures. The water molecules detected within 3.5 Å from the water channels in red for the 1.89 Å RT structure (PDB ID: 7RF1) and cyan for the 1.95 Å cryo structure (PDB ID: 4UB6). Extra water molecules in the 1.95 Å cryo structure (PDB ID: 4UB6) detected within 5 Å away from the bulk are highlighted in blue circles. A comparison of the structural differences present in the O4 channel, O1 channel A and O1 channel B between the 1.89 Å RT structure (colored in red and labeled in black) and the 1.95 Å cryo structure (PDB ID: 4UB6) (colored in cyan and labeled in cyan) are shown in (c), (d), and (e), respectively. f Structural differences in waters of the Yz network between 1.89 Å RT structure (colored in red and labeled in black) and the cryo structure with PDB ID: 6JLJ (colored and labeled in cyan).

