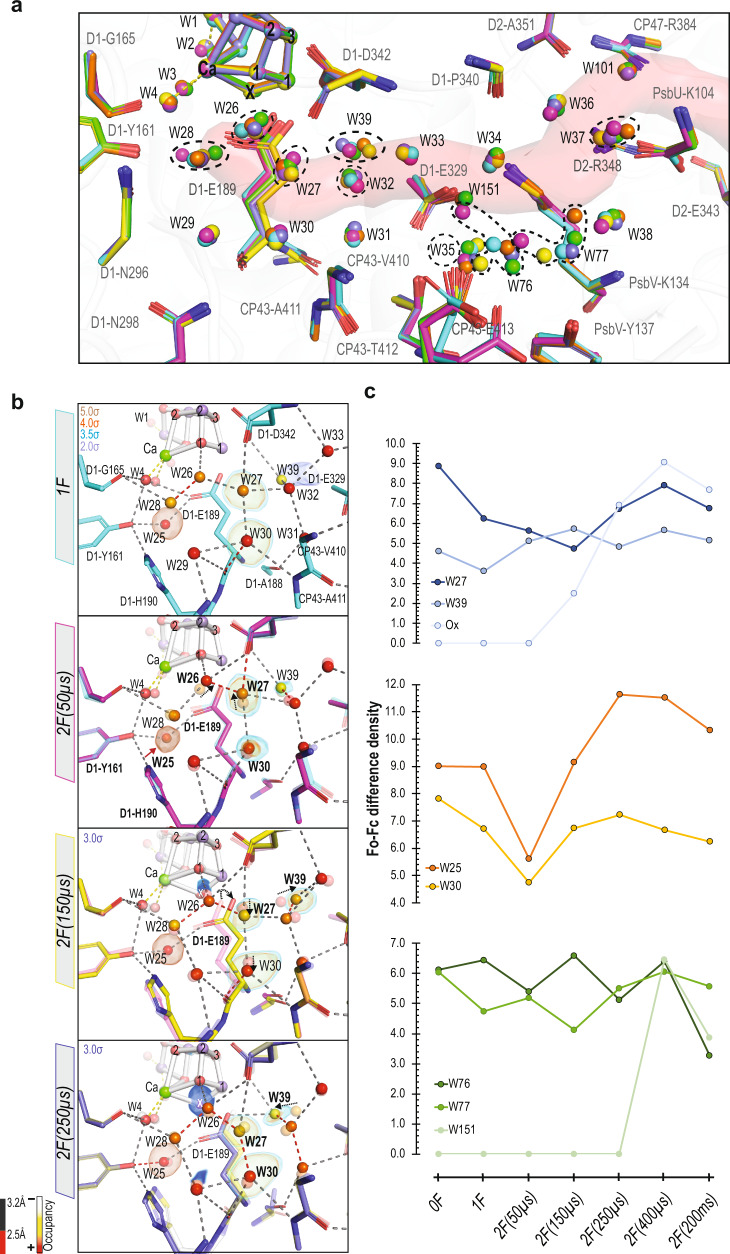
Fig. 3. Structural changes in the O1 channel during the S2 → S3 transition.
a The structural changes in the O1 channel are shown for all time points in the S2 → S3 transition (1F (teal, PDB: 7RF3) and 2F time points (50 µs: magenta, PDB: 7RF4; 150 µs: yellow, PDB: 7RF5; 250 µs: slate, PDB: 7RF6; 400 µs: orange, PDB: 7RF7; 200 ms: green, PDB: 7RF8)). O1 channel is in red. Waters that show significant movement during the S2 → S3 transition are marked with a black dashed circle. (B): Structural changes at the beginning of the O1 channel during the transition at different time points: (1F (teal) and 2F time points (50 µs: magenta; 150 µs: yellow; 250 µs: slate)). Each model overlaid with the model of the earlier time point, shown in a transparent color. The waters are colored based on their occupancies, represented by a color gradient from white to red as shown at the bottom left. The positions for certain waters are confirmed by Fo-Fc omit maps contoured at different σ levels (3.5σ, 4σ) with the exception of W30 at 1F and Ox omit maps contoured at 2σ and 3σ, respectively. The H-bond length is color-coded, as described at the bottom left. Movements of W26, W27, W39, and D1-E189 are marked with black dashed arrows. c Difference density heights from the Fo-Fc omit maps for selected waters in the O1 channel and Cl1 channel. Source data are provided as a Source Data file.

