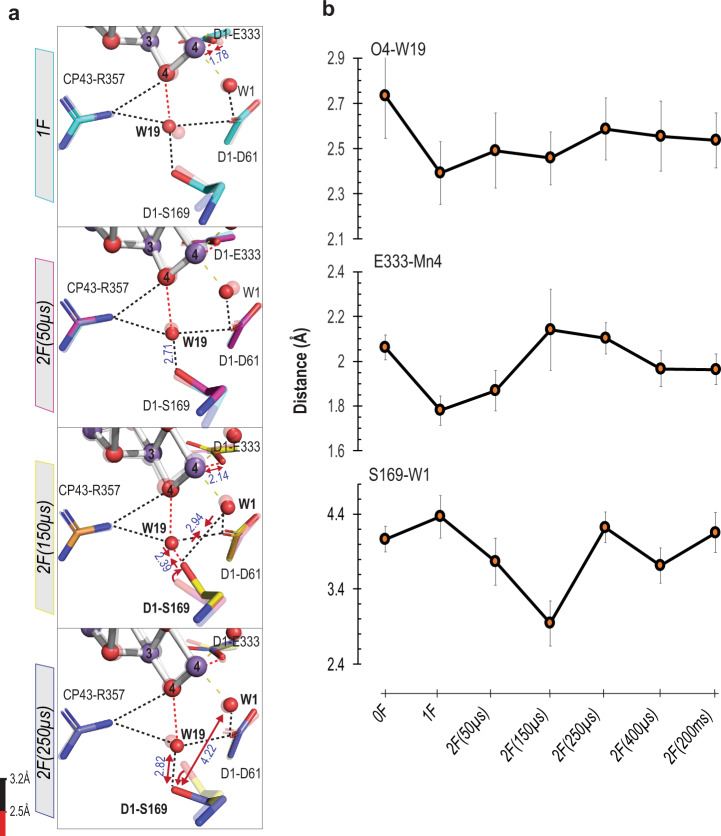
Fig. 4. Changes near W1 and O4 environment during the S2 → S3 transition.
a Structural change in the region of W1 and O4. The structures at different time points are indicated in the left margin, each in solid colors overlaid with the earlier time point, which is in a transparent color scheme (0F (white, PDB: 7RF2), 1F (teal, PDB: 7RF3) and 2F time points (50 µs: magenta, PDB: 7RF4; 150 µs: yellow, PDB: 7RF5; 250 µs: slate, PDB: 7RF6)). The H-bond length is color-coded, as described at the bottom left. Red arrows indicate elongation/shortening of the interatomic distances. The interatomic distances (Å) are shown in blue. 2 F(150 µs) structural data shows rotation in the D1-S169 sidechain affecting the H-bonding network. b Distance changes for selected bond lengths within the W1 and O4 environment during the S1 → S2 and S2 → S3 transitions. Error bars represent +/− one standard deviation of each distance calculated by generating 100 randomly perturbed datasets and re-refining, as described in SI Methods and centered around the final refined value for the distance. Source data are provided as a Source Data file.

