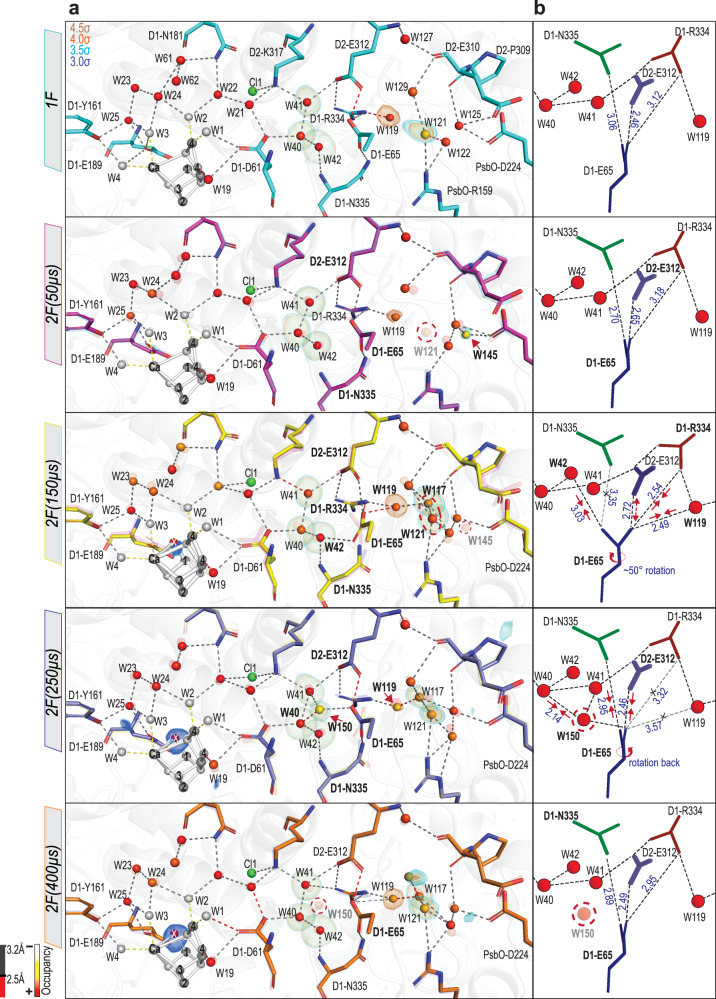
Fig. 5. Structural changes in the Cl1 water channel during the S2 → S3 transition.
a Structural changes in the protein and water molecules during the transition at different time points: (1F (teal, PDB: 7RF3) and 2F time points (50 µs: magenta, PDB: 7RF4; 150 µs: yellow, PDB: 7RF5; 250 µs: slate, PDB: 7RF6; 400 µs: orange, PDB: 7RF7)). Each model overlaid with the model of the earlier time point, shown in a transparent color. The waters are colored based on their occupancies, represented by a color gradient from white to red as shown at the bottom left. The positions for certain waters are confirmed by Fo-Fc omit maps contoured at different σ levels (3.5σ, 4σ) with the exception for W25, W119 and Ox omit maps contoured at (5σ, 4.4σ, and 3σ respectively). The H-bond length is color-coded, as described at the bottom left. Appearance and disappearance of W121, W117, W121, W145, and W150 at different time points are marked with a red dashed circle. b Model of the structural changes around D1-E65, D2-E312, and D1-R334. The H-bonds are shown in dashed black line and up to 3.2 Å. Red arrows indicate elongation/ shortening of the interatomic distances. The interatomic distances (Å) are shown in blue. The rotation of the D1-E65 at 2F (150 µs) is marked by a red circle arrow. The appearance and disappearance of W150 at 2F (250 µs) and at 2F (400 µs), respectively, are marked with a red dashed circle.

