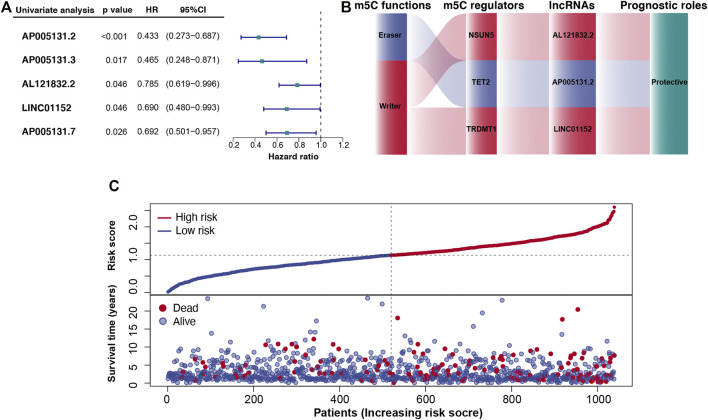
FIGURE 2.
Cancer-specific m5C-lncRNAs and their co-expression networks with m5C regulators in breast cancer (BC). (A) Forest diagram of univariate Cox regression analysis of m5C-lncRNAs. (B) Co-expression networks of the three m5C-lncRNAs screened using multivariate Cox regression analysis. (C) Distributions of risk scores and survival status of patients with BC based on m5C-lncRNA signature from the TCGA dataset.

