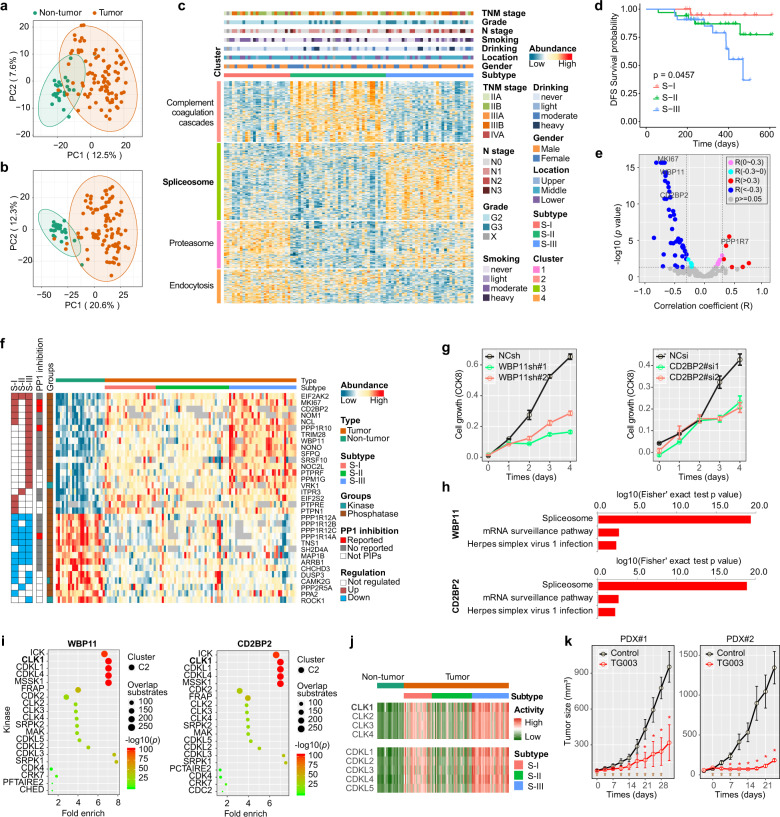
Fig. 1.
a, b PCA scatter plots of proteomic (a) and phosphoproteomic (b) datasets in 94 tumors and 24 non-tumor tissues. c Consensus clustering analysis of proteomic profiling identifies 3 proteomic subtypes:S-I (red), S-II (green), and S-III (blue). The associations of proteomic subtypes with clinical characteristics (TNM stage, grade, age, drinking, smoking, etc.) are annotated in the upper panel. Top two KEGG pathways related to these cluster signature proteins are denoted on the left, and annotated according to the KEGG pathway enrichment analysis (detailed in Supplementary Table S3). d Kaplan-Meier curves of disease-free survival (DFS) for each proteomic subtype in our cohort. e Volcano plot of the correlation coefficient (R) between phosphatase or phosphatase interacting protein (PIP) abundance with inferred phosphatase activity. f Differentially expressed phosphatase or phosphatase-PIPs and kinase profiles in three subtypes of ESCC and non-tumor tissues. g Effect of WBP11 (left) and CD2BP2 (right) knockdown on ESCC cell proliferation. h The top 3 KEGG pathways were enriched by the differentially expressed phosphorylation interactors (DEPIs) of WBP11 (top) and CD2BP2 (bottom). i Top 20 kinases in the pairing relationship analysis (PRA) of two PP1 PIPs, WBP11 (left) and CD2BP2 (right) opposed. The shape (dot or square) represents the cluster to which the kinase belonged. The size of dot or square represents the mapping number of proteins, the color of dot or square represents the significance. j Differentially inferred activity of CLKs and CDKLs profiles in three subtypes of ESCC and non-tumor tissues. k The average volume of tumors (± s.e.m.) of ESCC PDX model #1 and #2 treated with control (PBS) and TG003 at the indicated times. Brown arrows indicated the times of drug treatment

