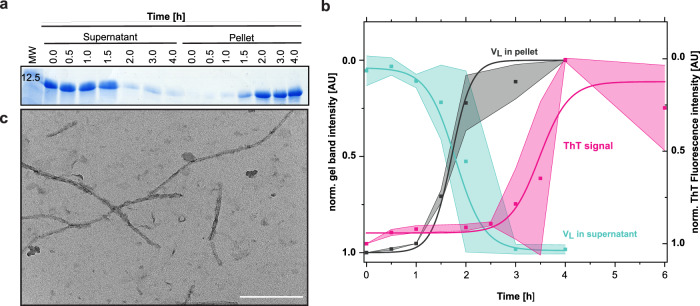
Fig. 1. Transition from soluble VL Pat-1 to insoluble fibrils.
a Soluble and insoluble fractions of Pat-1 VL during incubation at amyloid-promoting conditions. Samples were taken at the timepoints indicated and run on an 18% SDS-gel. b Quantified and normalized band intensities of the SDS-gel are shown in turquoise for the soluble VL domain (t1/2 = 1.79 h) and in black for the insoluble fraction (t1/2 = 1.71 h). Shades represent the SEM of n = 2. Fibril formation of Pat-1 VL as monitored by ThT fluorescence is shown in pink (t1/2 = 3.48 h). Values were fit to a Boltzmann function Shades represent the SEM of n = 3. c TEM micrograph of fibrils formed after 3 h of incubation. The scale bar represents 200 nm.

