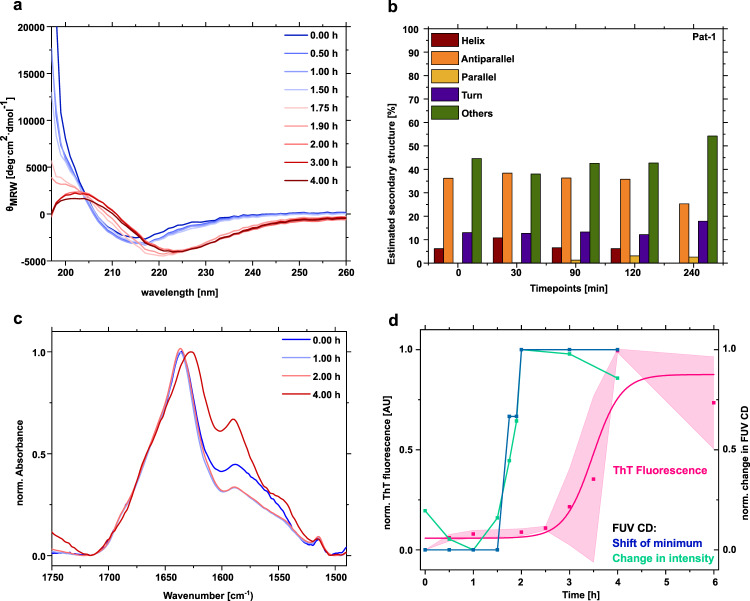
Fig. 3. Secondary structure changes during oligomer formation monitored by FUV CD-and FTIR spectroscopy.
a Comparison of changes in the secondary structure of Pat-1 in the lag phase. The spectra show the average of 10 individual scans. b Secondary structure analysis of the CD spectra of Pat-1 using the BeStSel algorithm. c Secondary structure changes in the lag phase monitored by ATR-FTIR after H/D exchange. The spectra of the amide I and II region were scaled to an absorbance of 1 and baseline corrected. d Comparison of the shift of the minimum in the spectra of different timepoints during the lag phase (blue), the change of intensity at 210 nm (green) with the fibril formation kinetics followed by ThT fluorescence (pink). Shades of the ThT fluorescence represent the SEM of n = 3.

