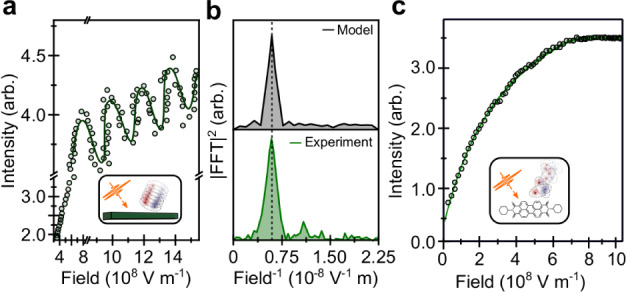
Fig. 2. Light-matter coupling in PDI nanobelts.

a Emission intensity as a function of optical field (laser fluence) for PDI nanobelts. After increasing linearly, the PL intensity then begins to oscillate at a frequency of 0.71 V−1 m after 8 ×10⁸ V m−1 revealing coherent emission from ~5 ×10⁷ molecules (inset). Data is obtained from averaging 3 up/down power sweeps. Solid black line show fit of model to data (Supplementary Note 5). In a similar manner to the reflectivity measurements in Fig. 1c,d not all sample locations exhibit coherent emission, likely due to nanoscale ordering beyond the resolution of our experiment. b Modelling the data51 allows extraction of the damping time for Rabi flopping (Supplementary Note 5). Strong agreement between the model and experiment is highlighted by the Fourier transform of the oscillation (bottom). The extra frequencies in the experimental data arise from the detuning of the laser pulse (590 nm, FWHM ~10 nm) from the excitonic transition (λmax = 512 nm). c In the case of the individual PDI chromophores (or densely packed nanobelts, Supplementary Note 5) no such behaviour is observed (solid line shows model fit) with the PL intensity increasing monotonically with optical field before saturating.
