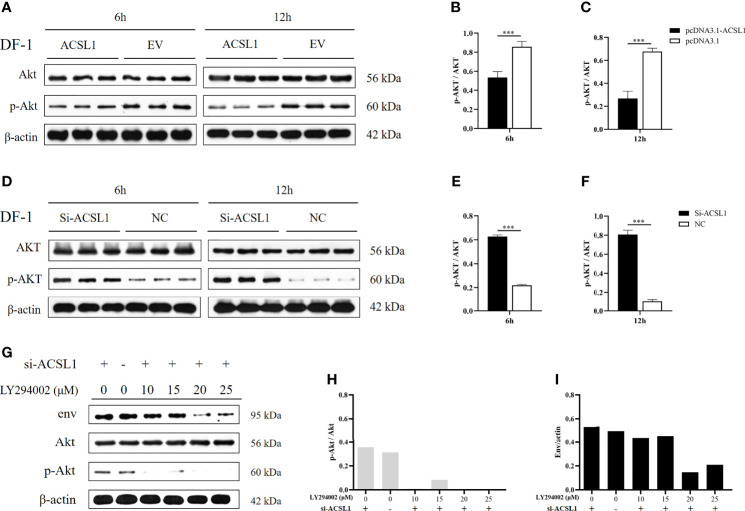
Figure 3.
ACSL1 inhibited the activation of Akt. (A–C) Immunoblot analysis of Akt and p-Akt expression from ACSL1 overexpression cells for the indicated time (A). Statistical analysis of the relative abundance of protein between p-Akt and Akt (B, C). (D–F) Immunoblot analysis of Akt and p-Akt expression from ACSL1 knockdown cells for the indicated time (D). Statistical analysis of the relative abundance of protein between p-Akt and Akt (E, F). (G–I) LY294002 were pretreated in ACSL1 knockdown cells for 1h and then infected with ALV-J. Immunoblot analysis of env, Akt, and p-Akt expression for the 12 h (G). Statistical analysis of the relative abundance of protein between p-Akt and Akt (H), env and actin (I). The experiments were repeated three times, independently, with similar results obtained. Data shown are the means ± SEM (n=3). P values were calculated using two-tailed unpaired Student’ t-test. Differences with P < 0.05 were considered significant. ***P < 0.001.

