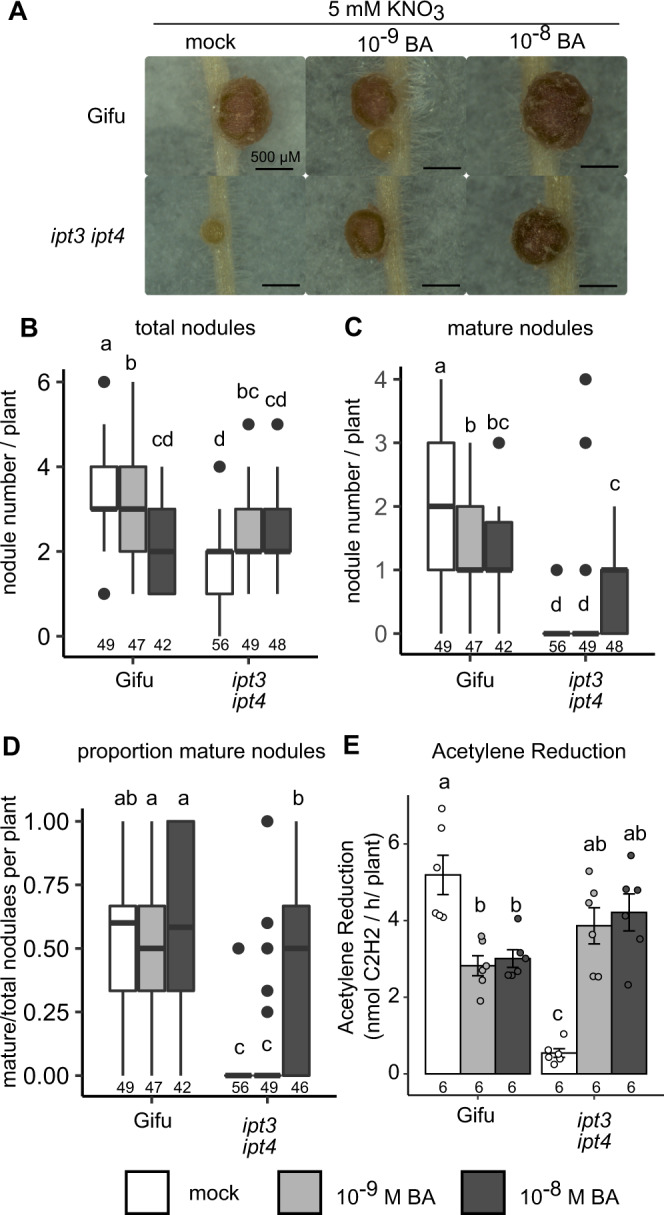
Fig. 5. Nitrate inhibition of nodule development can be rescued by cytokinin application.

A Images of nodules developed in the presence of 5 mM KNO3 with mock, 10-9 or 10-8 M BA at 14 dpi with M. loti on the indicated host genotypes. Scale bar = 500 μM. B–D Development of total (B), mature (C) and the proportion of mature nodules (D) in the presence of 5 mM KNO3 with mock, 10-9 or 10-8 M BA at 14 dpi with M. loti. E Nitrogenase activity assessed by ARA at 21 dpi with M. loti in the presence of 5 mM KNO3 with mock, 10-9 or 10-8 M BA. Box plots show Min, Q1, Median, Q3, Max and outlier values in nodulation assays (B–D). For ARA (E), bars show mean ± SE. Significant differences among different genotypes and concentration of BA are indicated by letters (p < 0.05) as determined by ANOVA and Tukey post-hoc testing. Pairwise P-values are available in the Source Data file. The n values of each group are shown.
