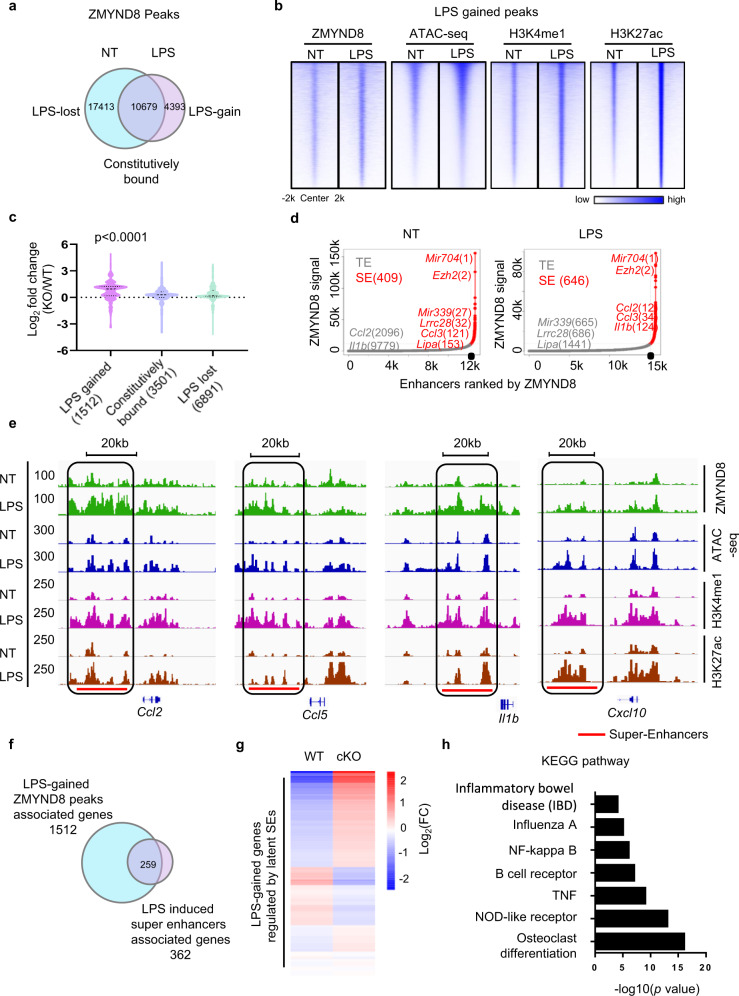
Fig. 2. LPS-induced ZMYND8 translocation onto the latent SEs regulating pro-inflammatory genes.
a Venn diagram analysis of ChIP-seq peaks of ZMYND8 in non-treated (NT) and LPS-treated BMDMs. LPS-gained, LPS-lost, and constitutively bound ZMYND8 peaks were labeled. b Heatmap analysis of ChIP-seq data obtained from NT and LPS-treated BMDMs. Peak density heatmap showing LPS-gained ZMYND8-binding signals, where the H3K4me1, H3K27ac, and chromatin accessibility (ATAC-seq) signals before and after LPS treatment were also shown. Each row shows ±2 kb centered regions of LPS-gained ZMYND8 peaks. c Based on the RNA-Seq results from WT and Zmynd8 cKO BMDMs, the violin plots summarizing the Zmynd8 deficiency-induced expression change of genes associated with LPS-gained, LPS-lost, and constitutively bound ZMYND8 peaks. P value by one-way ANOVA test. d Ranked plots of enhancers and super-enhancers defined in NT (left) and LPS-treated (right) BMDMs associated with increasing ZMYND8 signals (units: r.p.m.). Enhancers and SEs are defined as regions of ZMYND8 ChIP-seq binding not contained in promoters. The cutoff discriminating TEs from SEs is shown as a dashed line. Genes associated with enhancers that are considered typical or super are colored gray and red, respectively. e Genome Browser tracks showing ZMYND8, H3K4me1, H3K27ac ChIP-seq signals, and chromatin accessibility (ATAC-Seq) in the NT and LPS-treated macrophages at selected SE regions. f Genes associated with LPS-gained ZMYND8 peaks are overlapped with those LPS-induced latent SEs. g Heatmap analysis showing Zmynd8 deficiency-induced expression changes of genes regulated by ZMYND8-enriched latent SEs. h KEGG pathway analysis of genes associated with both LPS-gained ZMYND8 peaks and LPS-gained SEs. Source data are provided as a Source Data file.

