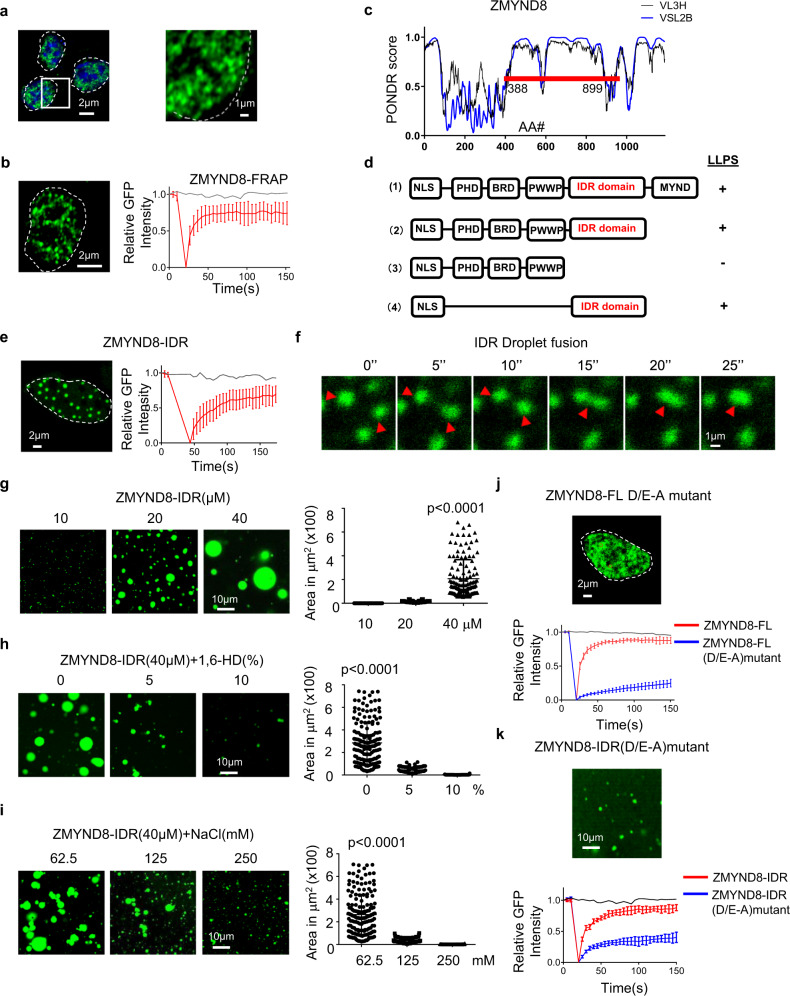
Fig. 3. ZMYND8 forms liquid-liquid phase separation in the nucleus.
a Immunofluorescence imaging of endogenous ZMYND8 in BMDMs. ZMYND8 signal (green) is shown merged with DAPI stain. Experiments were repeated three times. b FRAP experiment of GFP-ZMYND8 overexpressed in Raw264.7 cells (left), quantification of FRAP data for GFP-ZMYND8 puncta (right). Bleaching event occurs at t = 20 s. Data are plotted as mean values ± SD (n = 10). c Graphs plotting intrinsic disorder regions (PONDR VSL2B and VL3H) of ZMYND8. PONDR VSL2B and VL3H score (y-axis) and amino acid position (x-axis) are shown. The red bar designates the IDR under investigation. d Schematic of recombinant GFP fusion ZMYND8 fragments tested for LLPS. e ZMYND8-IDR fragment was transfected into HeLa cells and analyzed by FRAP (left), quantification of FRAP data for ZMYND8-IDR fragment puncta (right). Data are plotted as mean values ± SD (n = 10, examined over three independent experiments). f Droplet fusion is highlighted in a higher resolution and extended times frame as indicated. g Representative images of GFP-ZMYND8-IDR droplet formation at different protein concentrations. Data are presented as mean values ± SD (10 µM: n = 107; 20 µM: n = 116; 40 µM: n = 132; examined over three independent experiments). P value by one-way ANOVA test. h 1,6-Hexanediol (HD) was added at the indicated concentrations into solutions containing 40 μM GFP-ZMYND8-IDR. Data are presented as mean values ± SD (0%: n = 169; 5%: n = 160; 10%: n = 166; examined over three independent experiments). P value by one-way ANOVA test. i Representative images of droplet formation at different salt concentrations. Forty micromolar GFP-ZMYND8-IDR was added to the droplet formation buffer. Data are presented as mean values ± SD (62.5 mM: n = 169; 125 mM: n = 160; 250 mM: n = 166; examined over three independent experiments). P value by one-way ANOVA test. j All aspartic acid (D) and glutamic acid (E) residues in IDR were mutated to alanine (A) to generate mutant D/E-to-A (D/E-A). Then full-length (FL) WT (n = 7 samples), ZMYND8 (red line), and mutant (n = 10 samples) (blue line) were transfected into HeLa cells (upper), followed by FRAP quantification assay (lower). Data are presented as mean values ± SD. Cells were examined over three independent experiments. k Representative images of droplet formation of GFP-ZMYND8-IDR (D/E-A mutant) in vitro (upper) and analyzed by FRAP (lower). Red line: WT IDR (n = 10 samples); blue line: D/E-A mutant (n = 9 samples). Data are presented as mean. values ± SD. Source data are provided as a Source Data file.

