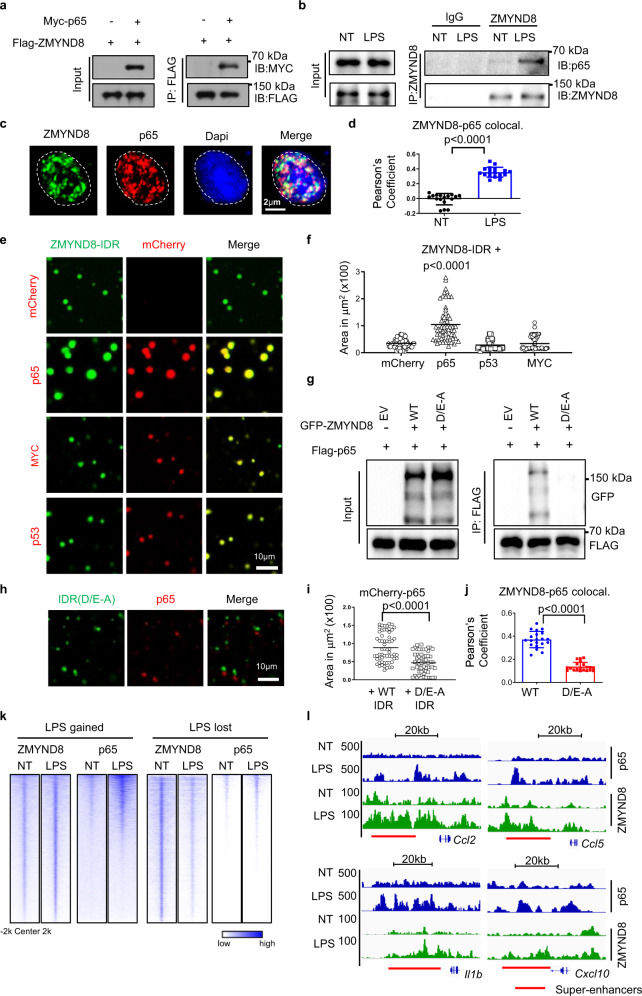
Fig. 5. p65 guides the redistribution of ZMYND8 liquid condensates onto NF-κB associated SEs.
a 293 T cells were transfected with Myc-p65 and Flag-ZMYND8 for 24 h, followed by Co-IP and western blotting with FLAG antibody. Experiments were repeated three times. b Endogenous Co-IP and western blotting with anti-ZMYND8 antibody in NT and LPS-treated BMDMs. Experiments were repeated three times. c Immunofluorescence staining of endogenous ZMYND8 (green) in primary mouse BMDMs shows colocalization with endogenous p65 (red) after treatment with LPS for 1 h, DAPI nuclear staining in blue. d Quantization of colocalization: the graph represents Pearson’s coefficient of ZMYND8 and p65 from three independent treatments of primary mouse BMDMs. Colocalization of ZMYND8 to p65 shows a significant difference between non-treated (NT) and LPS-treated (LPS) cells. Data are presented as mean values ± SD (n = 17 cells). Two-tailed Student’s t-test determined p values. e Droplet formation of various TFs with GFP-ZMYND8-IDR in droplet formation buffers containing 125 mM NaCl and 10% PEG8000 in vitro. Ten micromolar of GFP-ZMYND8-IDR was added into 10 µM of mCherry, mCherry-p65, mCherry-MYC, and mCherry-p53, respectively. Representative images were shown. f Statistical analysis of the coalescent droplet size when GFP-ZMYND8-IDR mixed with mCherry, mCherry-p65, mCherry-p53, and mCherry-Myc, respectively (n = 60, examined over three independent experiments). P value by one-way ANOVA test. g 293 T cells were transfected with Flag-p65 and EV, GFP-ZMYND8, GFP-ZMYND8 mutant (D/E-A) for 24 h followed by Co-IP and western blot with anti-FLAG antibody. Experiments were repeated three times. h Representative images of separated droplet formation when mCherry-p65 was incubated with GFP-ZMYND8-IDR mutant (D/E-A). i Statistical analysis of the mCherry-p65 droplet size, when WT-ZMYND8-IDR and GFP-ZMYND8-IDR D/E-A mutant was added in droplet formation buffer respectively (n = 60, examined over three independent experiments). Two-tailed Student’s t-test determined p values. j The colocalization of p65 with WT ZMYND8 or D/E-A mutant in Raw264.7 cells was evaluated by IF. Data are presented as mean values ± SD (n = 20 cells, examined over three independent experiments). Two-tailed Student’s t-test determined p values. k Heatmap analysis of the colocalization of p65 ChIP-Seq signals with LPS-gained and LPS-lost ZMYND8 peaks. l Genome browser view of ChIP-seq peaks of ZMYND8 and p65 at indicated SE regions in NT and LPS treated BMDMs. Source data are provided as a Source Data file.

