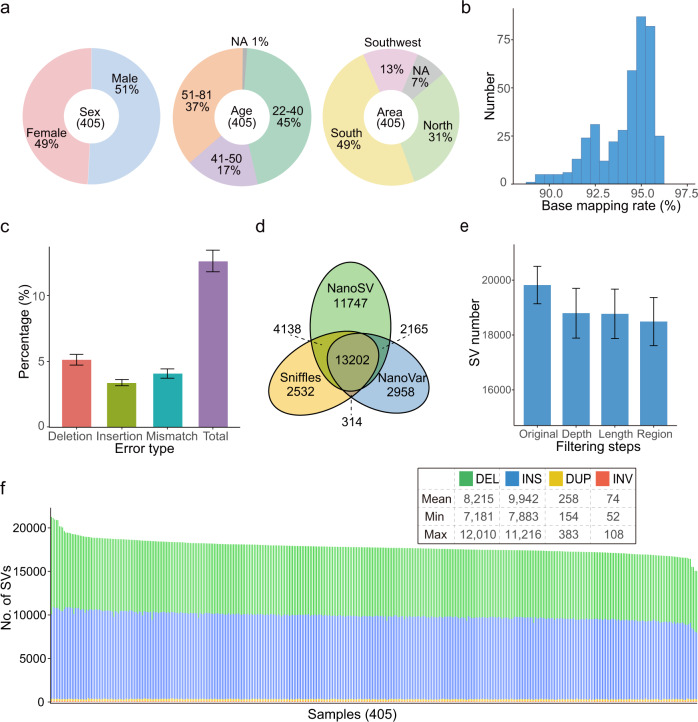
Fig. 1. Overview of samples, datasets, and SVs.
a Studied sample information overview, “NA” denotes not available. b Distribution of the base-mapping rate of clean data aligned to the reference genome GRCh38. c Error rate represented as percentage for each type (n = 405 per group). d Average number of SVs identified by Sniffles, NanoVar and NanoSV per individual and the overlap among them. e Average number of SVs after each filtering step (n = 405 per group), “Original” represents unfiltered SVs detected by at least two callers, “Depth”, “Length”, and “Region” represent SVs filtered according to the supported read number, extra-long intervals, and very low-complexity regions, respectively. f Number of SVs of each type in each individual. Data are represented as mean ± SD in c and e.

